


BTC Volatility (July 13 - July 20)

Key Indicators
(Hong Kong Time: July 13, 4 PM to July 20, 4 PM): BTC/USD rose 2.0% ($62,900 → $64,150), ETH/USD rose 4.2% ($1,785 → $1,860)
BTC/USD Spot Technical Outlook
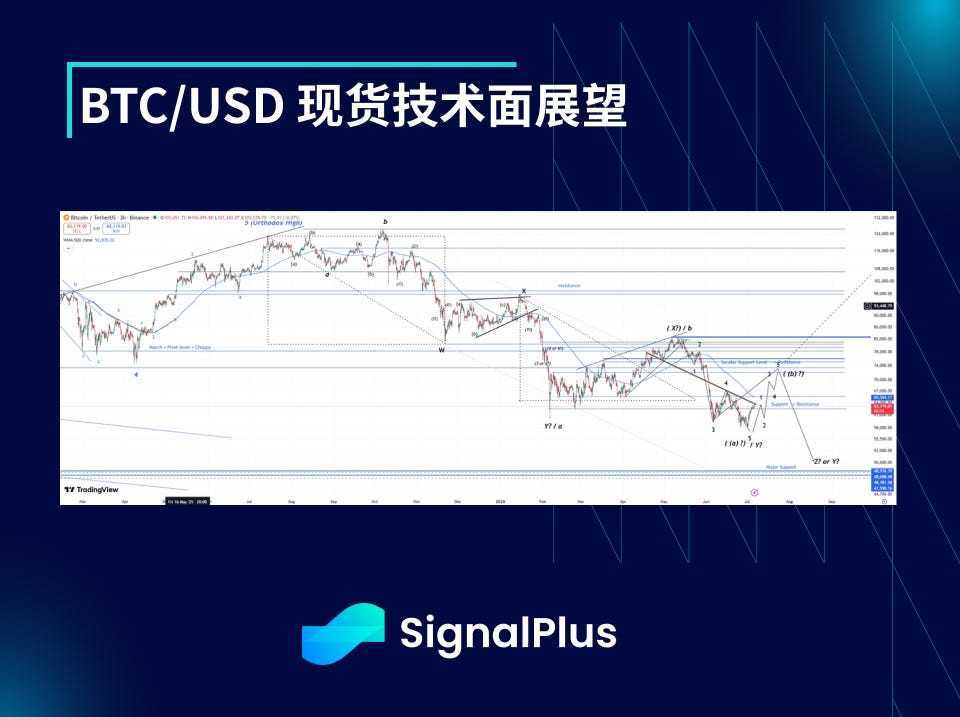
- Last week, BTC (and ETH) prices showed relatively strong performance, generally aligning with the mid-term technical analysis we have been tracking over the past few weeks. This was also driven by rising market expectations for progress on the "CLARITY Act" in the US Congress before it enters summer recess starting August 8. In the short term, despite broad risk-off sentiment in the stock market due to deleveraging in the KOSPI and AI-related trades, and further escalation of the US-Iran war situation, BTC still found support above $62,000. Meanwhile, the $64,500–$65,000 region remains a strong resistance zone. Currently, we still expect prices to rise slowly in a sideways consolidation pattern, while noting the positive signal of higher short-term lows. As the "CLARITY Act" becomes the focus of market attention, related news may bring noise and disrupt short-term technical trends. However, we remain focused on the support zone below at $60,000–$61,000. If this zone is breached, prices may first attempt to re-test $58,000, potentially forming a final decline in a sub-wave, targeting $50,000–$55,000. On the other hand, if prices clearly break through the resistance near $64,500–$65,000, they are expected to first attempt to break $68,000, followed by a further push towards the stronger resistance near $74,000. At that point, the market will ultimately need to judge: whether this round's low has already formed and will continue to surge significantly; or if prices will weaken again, making one last dip below $60,000 before launching a more substantive rally for the year. ## Market Themes - Last week, the overall market exhibited risk-off sentiment, although better-than-expected CPI data provided a slight boost to risk assets early in the week. However, the escalating US-Iran situation eventually transmitted to oil prices, with Brent crude breaking $90 per barrel, up slightly over 20% from recent lows. Meanwhile, deleveraging continued in KOSPI and AI-related trades within the stock market. Bankruptcies among young adult retail investors in South Korea continued to rise, and regulators began taking measures to restrict further leveraged trading in the short term. Overall, we believe the latter represents a healthy adjustment for the market; whereas the former may continue to pressure risk assets throughout the summer. If geopolitical uncertainty persists long-term, it could keep oil prices high, with interest rates remaining elevated for longer. With no clear solution in sight, the tail risk of escalation or miscalculation is rising. Crypto market sentiment has improved overall, with statements from the White House boosting optimistic expectations for the "CLARITY Act." As summer recess approaches, the window for the bill's approval is narrowing; after recess, midterm elections may become the dominant political agenda, potentially delaying the bill's passage until 2027. The market continues to record ETF fund inflows, but the $64,500–$65,000 region still faces strong resistance. Current market positioning feels very light overall. Short-term traders covered their short positions when prices were squeezed to $64,000, while medium-term investors have evidently reduced or exited positions over the past 4–6 weeks. We also continue to observe miner selling trends. Although the market has established some upward positions for the next two weeks, if the "CLARITY Act" is passed within the next 2–3 weeks, the market may be forced to chase the rally, pushing BTC up to $68,000. Polymarket currently shows a 38% probability of passage, meaning there is still significant upside potential once the bill lands. On the other hand, if Middle East tensions sustain risk-off sentiment and the "CLARITY Act" fails to pass within the next 2–3 weeks, market disappointment could drag BTC back down to $60,000–$61,000. Since ETH had outperformed BTC driven by optimistic expectations, a reversal in sentiment could lead to a faster drop to $1,600.
BTC Volatility
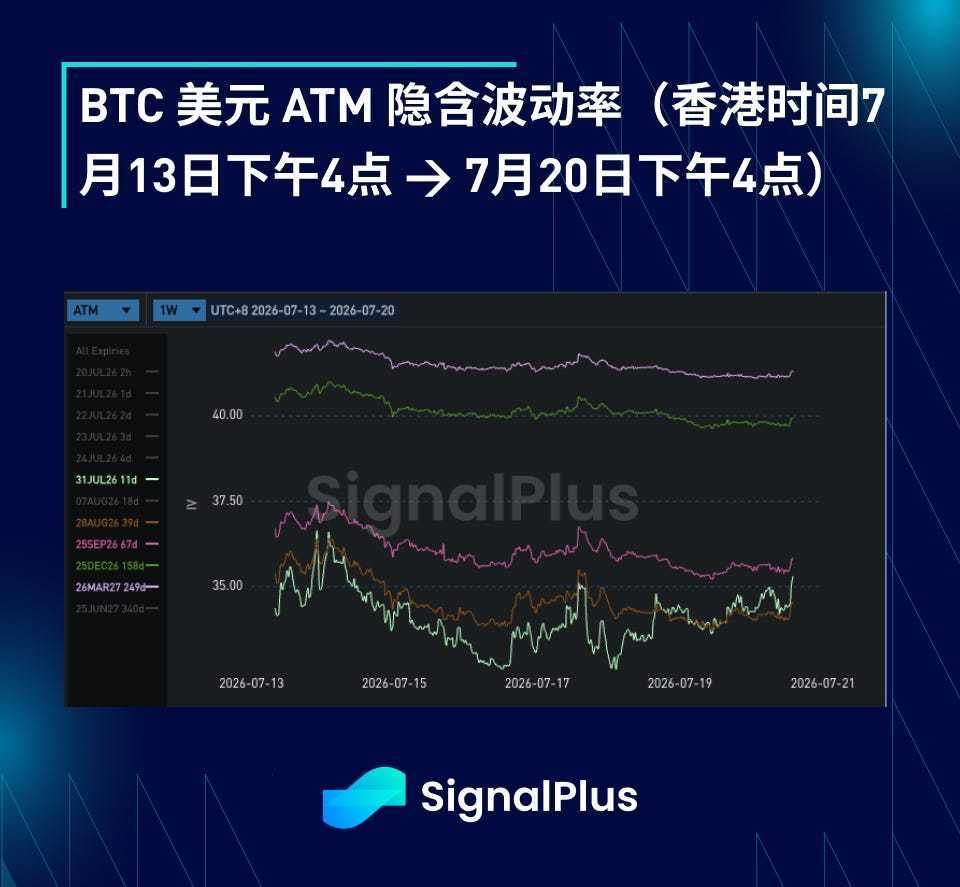
- Implied volatility declined overall last week, although realized volatility saw a slight rebound from the extremely low levels of the previous week. However, most of this volatility was event-driven, primarily related to CPI data and optimistic expectations for the "CLARITY Act." As summer deepens, market participation continues to decline, with investors becoming increasingly accustomed to BTC temporarily ranging between $60,000 and $66,000. The only exception was some high-leverage demand for upside exposure in contracts expiring on July 31, used to hedge against the possibility of the "CLARITY Act" accelerating passage before summer recess, which drove up implied volatility for that tenor. Even so, this remains a highly concentrated short-term bet. Even if the bill is approved, the market has not shown interest or expectation for structurally sustained price increases. On the other hand, with a noticeable reduction in spot holdings in the market, we have not observed significant demand for downside hedging. Meanwhile, covered call sellers continue to sell options on both the upside and downside simultaneously to enhance yields in the current range-bound environment. As the market officially enters summer and spot prices continue to consolidate within this equilibrium range, the implied volatility term structure has begun to steepen. We still expect realized volatility to pick up starting in September, especially considering the US midterm elections and the broader macro background. Market expectations for the Fed's first rate cut have been pushed back from July–August to September–October. However, given that we are approaching mid-summer, the market currently lacks interest in September–October trading. This has pushed forward volatility valuations at the far end of the curve down to the lower end of the past two-year range. We believe the current level presents an opportunity to start accumulating long positions as a value investment strategy.
BTC USD Skew / Kurtosis
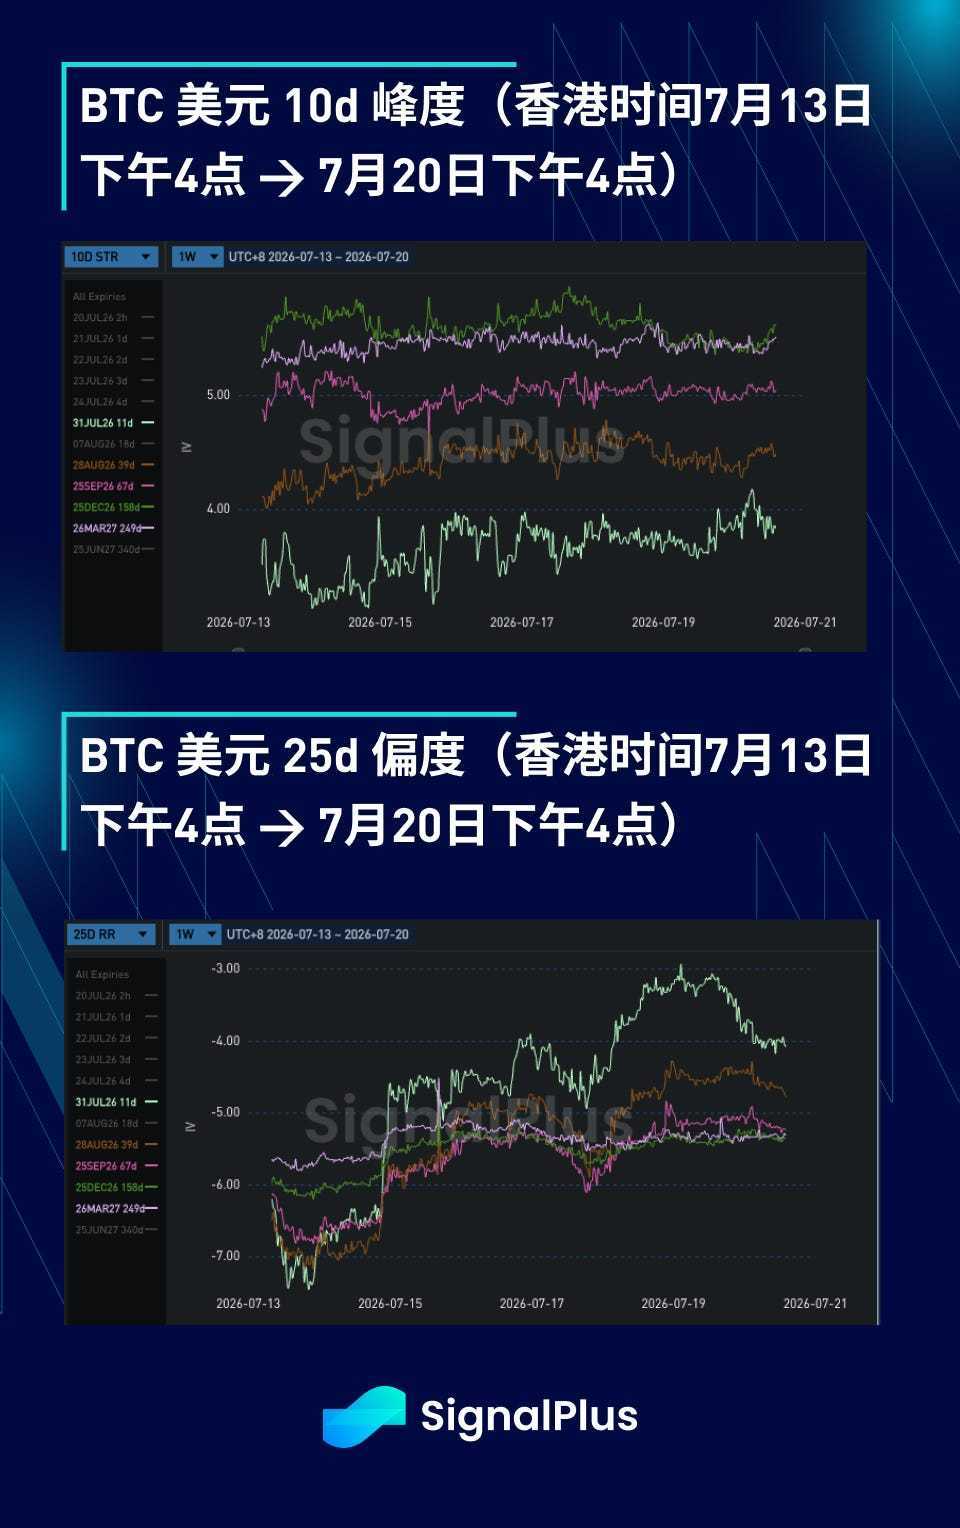
- Last week, skew pricing showed a reduced tilt towards put options, mainly because prices remained relatively strong despite external risk-off conditions, and short-term tenor upside demand began transmitting to the overall volatility curve. We also observed that some covered call sellers, who previously focused on selling call options, began adding put sales to their strategies. This reflects growing confidence in the downside price trend as recent price lows continue to rise. Current kurtosis pricing has found some support near existing levels. With skew repricing, downside volatility appears relatively low compared to recent levels. Considering the current geopolitical backdrop, the market remains unwilling to sell downside tail risk at too low a price. Additionally, since MSTR and STRC have not shown any clear signs of recovery, Saylor may need to continue selling assets in the coming months, so the market remains vigilant regarding downside tail risk. On the upside, demand for single long calls and narrow call spreads has largely absorbed some of the upside wing volatility. Previously, heavy supply from covered option sellers had accumulated significant long volatility exposure in this area. Now that this supply pressure has eased, it further supports kurtosis pricing.
Wishing everyone a successful trading week!
The copyright of this article belongs to the original author/organization.
The views expressed herein are solely those of the author and do not reflect the stance of the platform. The content is intended for investment reference purposes only and shall not be considered as investment advice. Please contact us if you have any questions or suggestions regarding the content services provided by the platform.
Post your comment

No Comments