


BTC Volatility Weekly Review (August 3 - August 10)

Key Indicators (Hong Kong Time: August 3, 4:00 PM – August 10, 4:00 PM):
- BTC/USD rose 4.7% ($62,300 → $65,200)
- ETH/USD rose 5.2% ($1,830 → $1,925)
BTC/USD Spot Technical Outlook
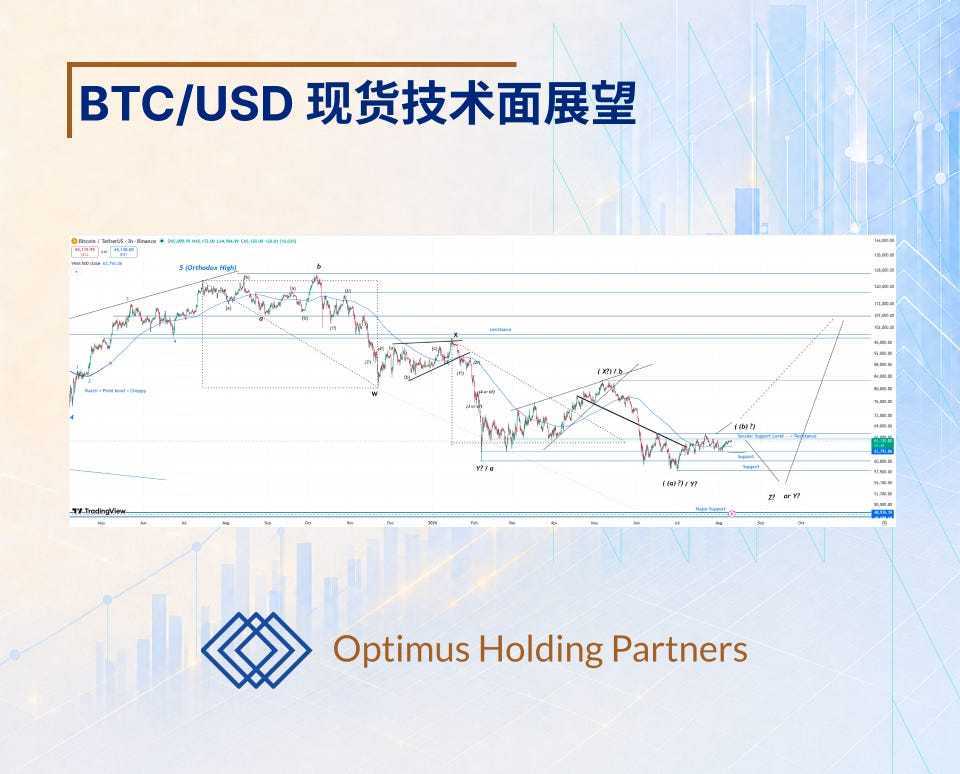
- Recent spot prices have remained exceptionally stable, maintaining the $62,750–65,500 range, which has suppressed actual volatility to "mid-summer" levels. Currently, the market is still wavering between two views: one is that this bear market trend has "ended"; the other is that one last "terminal" drop is still needed before the market fully clears out residual positions. We still expect July/August to October to be the time window for the bottom of this bear market, after which the market will start a bullish rally from the low point.
- On the upside, if the price clearly breaks through $67,500 and then $70,000, it may mean that the bottom has formed; conversely, if the market stalls at current levels, it may signal that the last round of declines is imminent. On the downside, we first focus on support at $62,000–62,500, followed by the stronger support zone of $58,000–60,000. Although market participants believe that the CLARITY Act and the September FOMC meeting could act as catalysts, we believe that from the current stage, the performance of various risk assets, the weakening of fiat currencies, and the significantly cooling inflation outlook may combine over time to trigger cyclical capital inflows and drive cryptocurrencies into a new round of rallies. With the world seemingly having given up, FOMO will ultimately become the primary driving force. Therefore, we expect the true rally in the future to be parabolic, causing particular pain to short sellers and investors who have been watching from the sidelines.
Market Themes
- Pushed by several factors, the overall market showed an increase in risk appetite over the past week: 1) U.S. corporate earnings continued to grow and were generally better than market expectations, pushing the S&P 500 index to new all-time highs; 2) Weak U.S. employment data, combined with Trump's remarks that interest rates should be cut, caused doubts about the market's expectation of a Fed rate hike in September, with related probabilities dropping from 60%–65% to 40%–45%; 3) Tensions in the Middle East have eased somewhat, with neither the U.S. nor Iran further escalating the conflict, and it currently seems to be moving towards an agreement. The shift in the Fed's stance has overall driven the dollar weaker, while the yen also benefited from some intervention factors. Meanwhile, gold finally broke through the consolidation range of the past few months, accumulating gains of about 8% for the week.
- Supported by favorable macro conditions such as rising stock markets, a weaker dollar, and rising gold, crypto market sentiment improved again overall last week. Offsetting this positive news was the lack of progress on the CLARITY Act; Congress has now entered its summer recess, and the likelihood of passing the bill in September before the midterm election process begins is low. Overall, the market continues to maintain range-bound consolidation: BTC remains stable in the $64,000–65,500 range, while ETH hovers around $1,900. ETF fund inflows remain healthy, with BTC ETF net inflows of $850 million and ETH ETF net inflows of $250 million last week. We expect the consolidation pattern to continue in the short term; if favorable macro conditions persist, passive ETF fund inflows should resume, but possibly at a slower pace.
BTC Implied Volatility
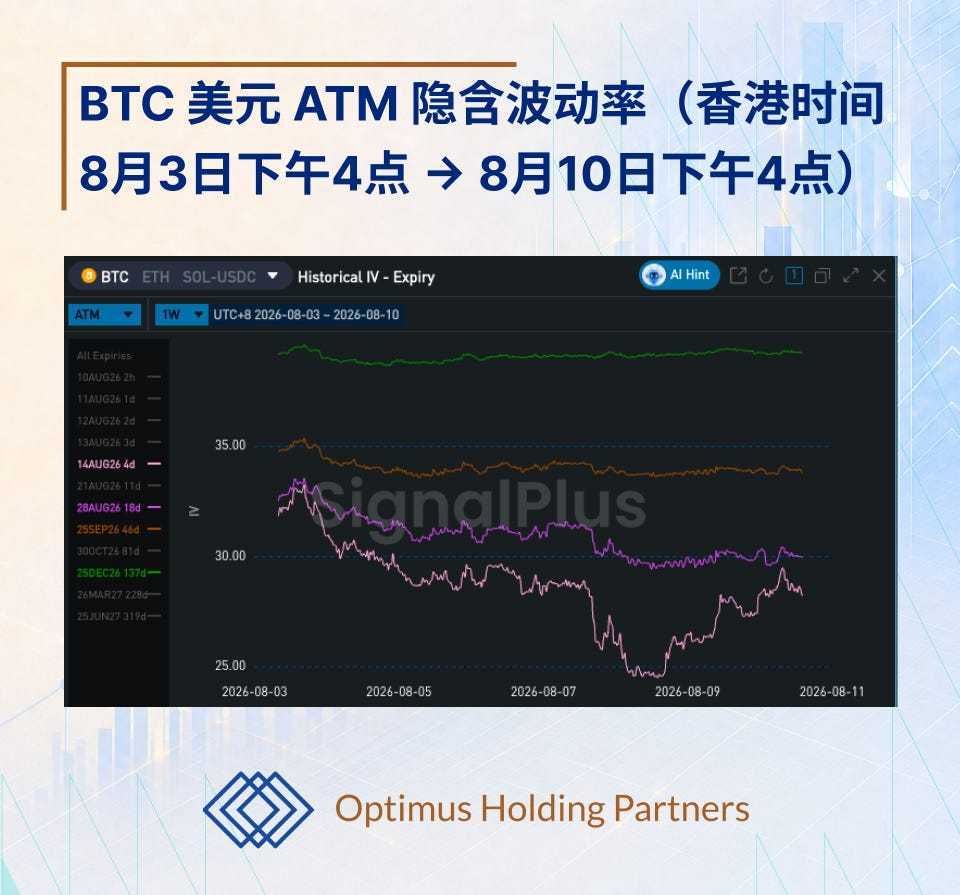
- Implied volatility declined slowly overall last week, mainly due to low actual volatility, spot prices remaining in range-bound consolidation, and a calmer macro environment driving down volatility across various asset classes. During the week, BTC daily implied volatility dropped to 25–26 vol, the lowest level since last summer. However, actual volatility was even lower, so the overall decline in implied volatility is reasonable. More noteworthy is that long-dated volatility has once again begun to approach historical lows, indicating that the market currently lacks more structural interest or demand for cryptocurrency options and volatility exposure.
- The term structure of the volatility curve steepened further overall last week. Affected by sluggish actual volatility, the curve moved as a whole in a weighted shape. However, forward volatility on the curve was already low, and its absolute level is now close to historical lows. We still expect actual volatility to rebound from September to year-end, especially considering midterms and the macro background. If the Fed fails to raise rates in September, its credibility may be affected, opening space again for dollar depreciation trades. Additionally, since the CLARITY Act has missed the deadline before the summer recess, there is still some parliamentary review time in September that could be used to advance the bill; however, given the short time window, the likelihood of passage remains low. The currently steep curve, combined with low actual volatility, may limit the upside potential of long-dated implied volatility in the short term. However, we believe that the current absolute volatility level has begun to be worth holding, suitable for gradually and continuously accumulating long positions.
BTC Skew / Kurtosis
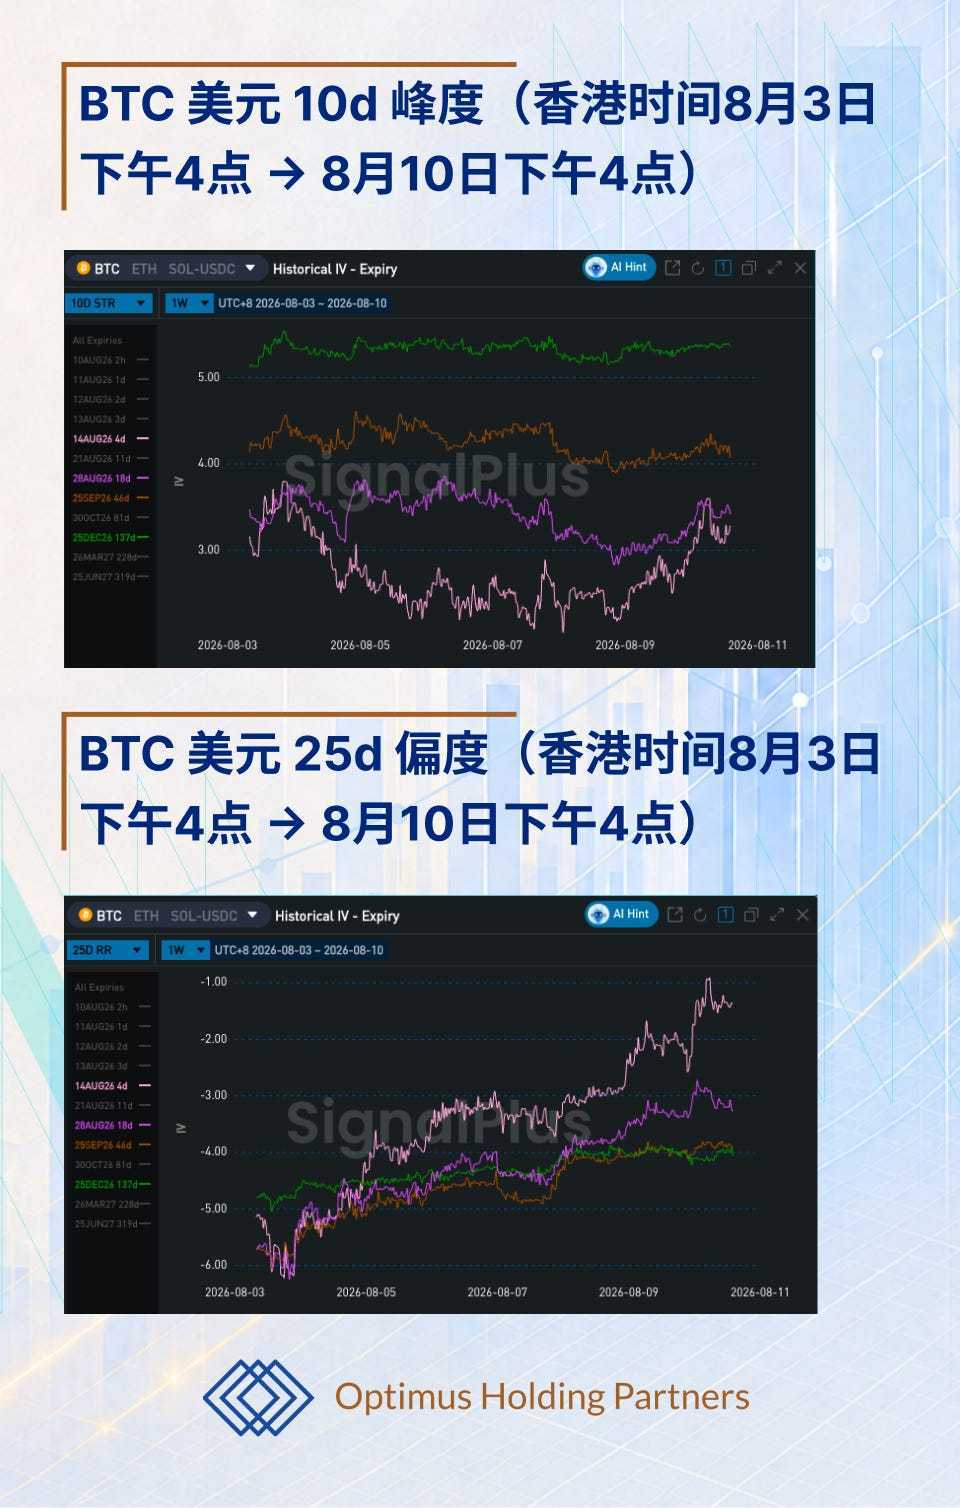
- The skew price continued to fall, meaning the premium of put option volatility relative to call option volatility narrowed further. This is because, under favorable macro conditions, BTC's downside tail risk has decreased; meanwhile, MSTR continues to increase its cash buffer, choosing to sell MSTR stock rather than BTC to raise funds, thereby reducing the risk of forced liquidation of BTC. Demand for call-side volatility remains very limited. Due to low ATM volatility and the fact that risk reversals at the far end of the term curve still clearly favor puts, long-dated call-side volatility is now at an absolute historical low. If the market truly rallies, we expect the actual volatility performance on the call side to exceed current implied pricing, as market positions are currently light and the supply of upside options such as covered selling has also decreased.
- Kurtosis prices remained flat overall, with short-dated kurtosis already at very low levels historically. The market is very clear that once the high-turnover consolidation range of roughly $62,000–67,000 that has constrained BTC over the past few weeks is broken, it will likely be accompanied by a simultaneous spike in both actual and implied volatility.
- Therefore, although there is still an opportunity to earn certain carry and roll-down yields in very short timeframes, on the basis of such low volatility, the market is still willing to pay costs to buy protection and hold options with strike prices outside the range. Even with continuous covered option supply on both sides of the spot price, this demand provides support for kurtosis.
Wishing everyone smooth trading in the coming week!

Optimus is a technology-driven digital asset trading and liquidity solutions provider, focusing on providing professional digital asset trading technology and services for institutional clients. The company independently develops core technologies such as algorithmic trading, market making, pricing, risk management, and API connectivity, providing efficient trading and liquidity management solutions for institutional clients.
The copyright of this article belongs to the original author/organization.
The views expressed herein are solely those of the author and do not reflect the stance of the platform. The content is intended for investment reference purposes only and shall not be considered as investment advice. Please contact us if you have any questions or suggestions regarding the content services provided by the platform.
