


 Likes Received
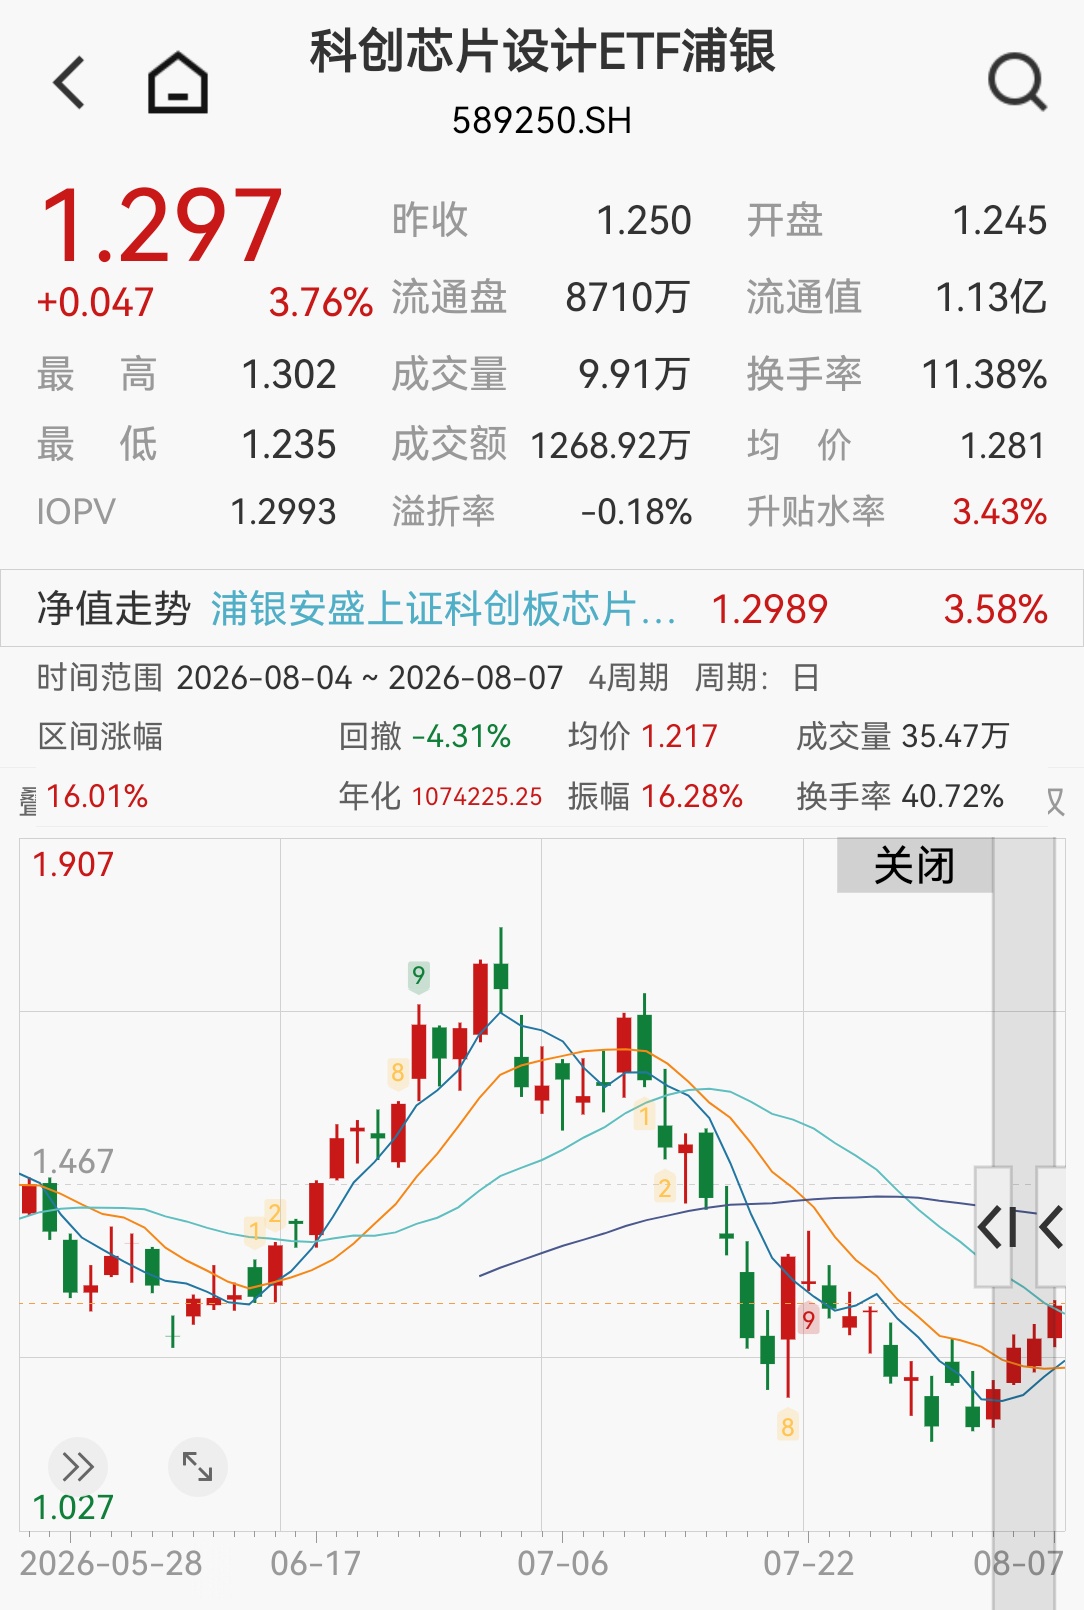
The Sci-Tech Chip Design ETF Pudian (589250) has accumulated a gain of 16% over the past 4 days.
On August 7, the STAR Market Daily reported that TSMC has achieved a breakthrough in next-generation technology. In collaboration with a team from National Yang Ming Chiao Tung University, they successfully developed high-performance monolayer molybdenum disulfide (MoS2) top-gate transistors, helping to break through the limits of Moore's Law. The related results were published in the journal *Nature Electronics*. For individual investors who are bullish on the chip design direction of the STAR Market but have not met the 500,000 RMB account opening threshold, the STAR Chip Design ETF Pu Yin (589250) offers a low-threshold way to participate—with an initial investment of just 100 shares. The STAR Chip Design ETF Pu Yin (589250) closely tracks the SSE STAR Market Chip Design Theme Index (950162), which precisely anchors chip design, a core segment of the semiconductor industry chain, providing investors with an efficient tool for one-click layout of domestic chip core assets. As of August 7, the annualized return of the SSE STAR Market Chip Design Theme Index (950162) over the past three years was 38.4%, significantly surpassing the annualized return of the STAR 50 during the same period, which was 21.64% (Data source: CSI Index, as of 2026.8.7).

In terms of track purity, digital chip design accounts for 79.31% and analog chip design accounts for 14.86% of this index, totaling 94.17%, making it one of the indices with the highest purity in chip design across the entire market (Data source: Wind, as of 2026.8.7). In terms of earnings growth, the index's net profit attributable to parents grew by 191.96% year-on-year in 2025, and by 260.14% year-on-year in the first quarter of 2026, showing outstanding growth potential (Data source: Wind). As of the close on August 7, the STAR Chip Design ETF Pu Yin (589250) rose by 3.76%, closing at 1.297 yuan, with a trading volume of 12.69 million yuan and a turnover rate of 11.38%. Among the index's weighted stocks, Xinpeng Micro rose 12.25%, Raytron Microelectronics rose 9.34%, ASR Microelectronics-U rose 8.39%, GigaDevice rose 6.95%, VeriSilicon rose 6.14%, while Amlogic fell 1.6% and Bestech fell 1.47%. The STAR Chip Design ETF Pu Yin (589250) had a total net inflow of 21.7766 million yuan in the past month, with an average daily trading volume of 15.77 million yuan. From August 4 to August 7, the STAR Chip Design ETF Pu Yin (589250) rose for four consecutive days, with a range gain of 16%.
[Industry Tailwinds: AI Computing Power Demand Drives Semiconductor Hardware Demand + Continuous Promotion of Chip Localization] The explosion in AI computing power demand directly drives upstream semiconductor hardware demand—the capital expenditures of the Big Four North American cloud providers exceeded $315 billion in 2025 combined. Alibaba plans to invest 380 billion yuan in cloud computing and AI infrastructure over the next three years, exceeding the sum of the past ten years; Tencent's capital expenditure plan for 2025 is 100 billion yuan, of which 34.9 billion yuan was spent in Q4 2024, a year-on-year increase of 421%. The sustained high growth in AI computing power demand directly drives upstream semiconductor hardware demand, injecting a new round of structural growth opportunities into the chip design industry. The process of chip localization continues to advance: the localization ratio of AI chips reached 35% in the first half of 2025. With the continuous increase in the demand for autonomous and controllable high-end chips, chip design, as the most technology-intensive and innovative core link in the semiconductor industry chain, will benefit from the localization wave first. [High Elasticity: Linked to the STAR Market, Single-Day Price Fluctuation Limit of 20%] In terms of elasticity, the SSE STAR Market Chip Design Theme Index (950162) is linked to the STAR Market and only includes chip design companies listed on the STAR Market. The single-day price fluctuation limit for constituent stocks is ±20%, offering greater elasticity and stronger offensive capability. During the chip sector recovery cycles of 2025 and the first half of 2026, the STAR Chip Index led with a gain of 208.24%, outperforming the CSI Chip Industry Index (185.52%) and the CNI Semiconductor Chip Index (179.67%), thanks to the high elasticity of the STAR Market and the 20% price fluctuation limit. (Data source: Wind, time interval: 2024.12.31-2026.06.30) [High Concentration of Leading Stocks: Top Ten Weighted Stocks Account for 63.27%, Storage + AI Chip Dual Tracks Cover Nearly 50%] Regarding the index's weighted stocks, the top ten weighted stocks of the SSE STAR Market Chip Design Theme Index (950162) account for a total of 63.27%. Among them, the storage direction (Montage Technology 9.27% + Biwin Storage 7.39% + Puya Shares 3.26%) accounts for nearly 20%, and the AI chip direction (Hygon Information 10.99% + Cambricon 9.26% + VeriSilicon 7.76%) accounts for 28%. The two high-prosperity tracks account for nearly 50% (47.93%) in total. For investors who are bullish on both storage chips and AI chips, this index can cover them with one click. (Data source: Wind, as of 2026.8.7) Regarding the index's weighted stocks, the top ten weighted stocks of the SSE STAR Market Chip Design Theme Index (950162) are as follows: Hygon Information (688041.SH) weight 10.99%, the company's sub-track is: AI Chip. Montage Technology (688008.SH) weight 9.27%, the company's sub-track is: Storage. Cambricon (688256.SH) weight 9.26%, the company's sub-track is: AI Chip. VeriSilicon (688521.SH) weight 7.76%, the company's sub-track is: AI Chip. Biwin Storage (688525.SH) weight 7.39%, the company's sub-track is: Storage. Raytron Microelectronics (688002.SH) weight 5.12%, the company's sub-track is: Analog/Sensor. Shengke Communication (688702.SH) weight 3.96%, the company's sub-track is: Network Chip. Amlogic (688099.SH) weight 3.29%, the company's sub-track is: SoC. Puya Shares (688766.SH) weight 3.26%, the company's sub-track is: Storage. Jiehuatex (688141.SH) weight 2.97%, the company's sub-track is: Analog Chip. (Data source: Wind, as of 2026.8.7) [Long-Term Performance of the Index: Up 207% Since 2023, Sharpe Ratio of 1.24 Far Exceeds Broad-Based STAR Market Indices] For investors pursuing high elasticity and able to withstand volatility, the long-term cost-effectiveness of this index is worth noting—cumulative gain since 2023 is 207.14%, while the STAR Composite Index is 69.56% and the STAR 50 is 73.27% during the same period; the annualized Sharpe ratio is 1.24, while the STAR 50 is only 0.74 and the STAR Composite Index is 0.73, meaning that under the same volatility, the excess return of this index is significantly higher (Data source: Wind, statistical interval 2023.1.1-2026.6.12). The SSE STAR Market Chip Design Theme Index (950162) has gained 207.14% since 2023, significantly outperforming broad-based STAR Market indices, and its annualized Sharpe ratio is 1.24, far higher than that of broad-based STAR Market indices, resulting in a better risk-return ratio. The comparison of cumulative gains and annualized Sharpe ratios between the SSE STAR Market Chip Design Theme Index (950162) and the STAR Composite Index, STAR 50, STAR 100, and STAR 200 indices is as follows: 1. Cumulative Gain in the Interval: The cumulative gain of the SSE STAR Market Chip Design Theme Index (950162) from January 1, 2023, to June 12, 2026, was 207.14%, significantly leading the STAR Composite Index (gain of 69.56% during the same period), STAR 50 (gain of 73.27% during the same period), STAR 100 (gain of 60.47% during the same period), and STAR 200 (gain of 69.06% during the same period). 2. Annualized Sharpe Ratio: The annualized Sharpe ratio of the SSE STAR Market Chip Design Theme Index (950162) from January 1, 2023, to June 12, 2026, was 1.24; the STAR Composite Index was 0.73 during the same period; the STAR 50 was 0.74; the STAR 100 was 60.47; and the STAR 200 was 69.06. The Sharpe ratio of the SSE STAR Market Chip Design Theme Index (950162) is significantly superior to that of the STAR Composite Index, STAR 50, STAR 100, and STAR 200 indices, with a significant advantage in risk-adjusted returns. (Data source: Wind, statistical interval: 2023.1.1-2026.6.12, the release date of the SSE STAR Market Chip Design Theme Index is 2024-07-26, the base date is 2019-12-31, the annual price fluctuations of the index from 2021 to 2025 were (%): 7.73, -42.51, 4.75, 35.54, 60.00, and the gain since the release of the index is 241.27%. Historical performance of the index does not predict future performance.) [Fund Product Information] - Fund Abbreviation: STAR Chip Design ETF Pu Yin - Trading Code: 589250 - Fund Manager Song Shiyi, Bachelor's degree from Shanghai Jiao Tong University, Master's degree from Renmin University of China, 12 years of securities practice experience, 2 years of fund management experience - Fund Management Fee 0.50% per year, Custody Fee 0.10% per year. (Data source: Fund Regular Reports, Wind, as of 2025.12.31) [Fund Company Introduction] SPDB AXA Funds has built a "Core-Satellite" index product matrix, with exchange-traded ETFs covering hard technology and mainstream broad-based indices, and off-exchange index enhancement products comprehensively 布局 ing Beijing, Shanghai, Shenzhen, and large, medium, small, and micro-cap styles. The total asset management scale exceeds 450 billion yuan, providing investors with a one-stop multi-asset allocation tool. 1. Shareholder Background SPDB AXA Funds is one of the first batch of bank-affiliated public funds in China. Shanghai Pudong Development Bank Co., Ltd. is the largest shareholder, holding 51% equity; BNP Paribas Asset Management Holding Company is the second-largest shareholder, holding 39% equity; Shanghai Guosheng Group Asset Co., Ltd. is the third-largest shareholder, holding 10% equity. The advantages of Chinese and foreign resources help multi-asset management. 2. Asset Management Scale As of December 31, 2025, the total asset management scale of SPDB AXA Funds (including subsidiaries) exceeds 450 billion yuan. Its businesses develop diversely, covering asset management businesses in multiple fields such as equity, fixed income, quantitative, and alternative investments, enabling it to provide investors with one-stop high-quality products and services. There are 117 public fund products under SPDB AXA Funds, with a fund scale under management of 357.506 billion yuan. 3. Differentiated Layout of Index Fund Products SPDB AXA Funds' on-exchange and off-exchange products form a "Core-Satellite" strategy combination. On-exchange layouts include A500 ETF Pu Yin (159376.SZ), ChiNext ETF Pu Yin (159810.SZ), Photovoltaic ETF Pu Yin (159609.SZ), STAR Chip Design ETF Pu Yin (589250.SH), Securities ETF Pu Yin (516730.SH), Gaming Media ETF Pu Yin (517770.SH), Grain ETF Pu Yin (159060.SZ), etc.; off-exchange launches include CSI 300 Index Enhancement, CSI A50 Index Enhancement, CSI A500 Index Enhancement, STAR Market 100 Index Enhancement, STAR Market Composite Enhancement, and other broad-based index enhancement products, as well as the SPDB AXA BSE 50 Component Index Fund tracking the Beijing Stock Exchange index, achieving comprehensive tracking of all exchanges in Beijing, Shanghai, and Shenzhen, as well as various sectors, and also achieving comprehensive coverage of large, medium, small, and micro-cap styles in terms of style. [Q&A] Q1: The threshold for the STAR Market is 500,000 RMB. What low-threshold ways are there for retail investors to invest in STAR chips? A: The participation threshold for individual investors in the STAR Market is relatively high. Investors need to have an average daily asset of no less than 500,000 RMB over 20 trading days (excluding margin financing and securities lending), and have investment experience of no less than 24 months. For investors who do not meet this threshold, the minimum investment threshold for the STAR Chip Design ETF Pu Yin (589250) is only 100 shares, allowing for lower-threshold investment participation with convenient trading. Q2: Compared to the STAR 50 ETF, how is the long-term return of the index tracked by this ETF? A: The SSE STAR Market Chip Design Theme Index (950162) has gained 207.14% since 2023, while the STAR 50 has gained 73.27% during the same period, with the latter's gain being less than 40% of the former's (Data source: Wind, as of 2026.6.12). The core difference lies in the fact that the STAR 50 covers all industries in the STAR Market, with limited chip proportion; whereas the SSE STAR Market Chip Design Theme Index focuses on chip design companies in the STAR Market, with higher track purity. Q3: What is the difference between chip design indices and semiconductor equipment indices? A: The SSE STAR Market Chip Design Theme Index (950162) excludes semiconductor materials, equipment, manufacturing, and packaging/testing links, and only anchors chip design, the most innovative and vibrant 细分 direction in the semiconductor industry chain—digital chip design 79.6% + analog chip design 15.4% = 95% (Data source: Wind, as of 2026.5.29). If you are bullish on the chip design link, this index is one of the purest choices among similar ones. Q4: Storage chips have risen so much. Does this index still benefit? A: In the top ten weights of the SSE STAR Market Chip Design Theme Index (950162), the storage direction (Montage Technology 9.27% + Biwin Storage 7.39% + Puya Shares 3.26%) accounts for nearly 20% in total (Data source: Wind, as of 2026.8.7). The global storage chip super cycle is still ongoing. South Korea's 4,755 trillion won expansion plan points to doubling DRAM capacity in five years. The storage direction remains an important weight component of this index. Q5: Does this index have earnings support? A: The index's net profit attributable to parents in 2025 was 13.109 billion yuan, a year-on-year increase of 191.96%; the net profit attributable to parents in the first quarter of 2026 was 6.425 billion yuan, a year-on-year increase of 260.14% (Data source: Wind). High earnings growth, rather than pure concept speculation. Q6: What is the core difference between this fund and other semiconductor ETFs? A: The product target index is laid out in the chip design link of the STAR Market, excluding semiconductor materials, equipment, manufacturing, and packaging/testing. The total weight of the top ten constituent stocks is 57.15%, with concentrated computing power leaders. Q7: What standard is the tracking error of this fund controlled at? A: Under normal circumstances, it strives to keep the absolute value of the daily average tracking deviation below 0.2%, and the annualized tracking error does not exceed 2%. Q8: What are the advantages of investing in this fund? A: First, it precisely focuses on the core track of chip design in the STAR Market, with digital chips and analog chips accounting for a total of 94.17% (Data source: Wind, as of 2026.8.7, industry classification is Shenwan Level III industry); Second, it benefits from the dual dividends of explosive growth in the global semiconductor market and accelerated domestic substitution; Third, the news side has received multiple positive catalysts, and industry prosperity continues to rise; Fourth, it lays out chip design leaders with one click through the ETF format, dispersing individual stock risks; Fifth, it starts with 100 shares, providing a channel for individual investors who cannot meet the 500,000 RMB account opening threshold of the STAR Market.
The copyright of this article belongs to the original author/organization.
The views expressed herein are solely those of the author and do not reflect the stance of the platform. The content is intended for investment reference purposes only and shall not be considered as investment advice. Please contact us if you have any questions or suggestions regarding the content services provided by the platform.
