


Estimation of AI Computing Power Capital Expenditure: $3-4 trillion can be calculated, but the conditions for realization are extremely stringent
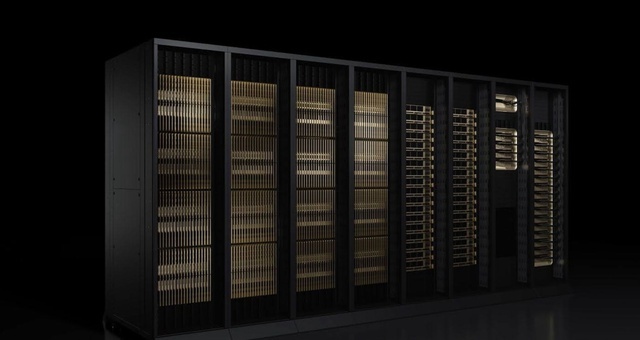
Figure: NVIDIA Rubin Computer Cluster Diagram
The implementation of Agent technology has truly given large models "hands" and "feet": The leap in Coding capabilities and the improvement of tool invocation have pushed AI from a "conversational assistant" to a new height of "autonomous executor"; on the other hand, the comprehensive tension in the supply chain has led the market to fully embrace hardware. The widely circulated investment bible is: "The US lacks electricity, China lacks chips, and there is always a shortage of storage."
As North America enters earnings season, the AI narrative stands at a subtle crossroads: Capital expenditures by major tech companies have exceeded expectations, yet global AI hardware stock prices have faced significant pressure one after another.
All debates revolve around where exactly the ceiling for future North American AI computing power capital expenditure lies? The actual market's optimistic expectation is already not low. Semi Analysis recently predicted that the US AI data center's new power demand will grow rapidly from 21GW in 2026 to 84GW in 2030.
Based on current hardware costs, each GW of AI data center investment requires at least $40 billion (if using the latest generation platform Vera Rubin, the upper limit of single GW investment can reach $47-50 billion). Thus, the volume of 80GW over 30 years implies that the total investment in AI infrastructure may reach $3-4 trillion.
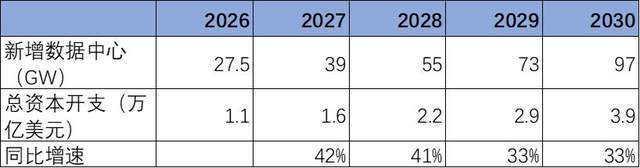
Table: Capital Expenditure Scale Corresponding to AI Construction Volume under High Expectations Source: Summary by Jinduan Research Institute
But questions arise accordingly: Can long-term revenue justify the rationality of this massive investment? Has the current intensity of capital expenditure touched its reasonable boundary? If the previous argument holds, where does this money come from? This article attempts to measure the rational ceiling of AI investment from a neutral and objective perspective.
01
Preface: Four Rounds of Demand Expansion and Anchoring Total Rationality
To understand the space for capital expenditure, one must first understand the underlying logic of why AI demand can expand. Since the end of 2022, AI large models have experienced four clear paradigm shifts:
○ The first round was the Q&A era initiated by text-to-text generation, bringing about an expansion in user breadth;
○ The second round was the completion of context and visual capabilities, bringing about an expansion in data capacity;
○ The third round was the era of reasoning and chain-of-thought, bringing about an expansion in deep information volume;
○ And the fourth round currently being experienced is the Agent era, where large models can complete extremely complex tasks.
The endpoint of every shift is the same result: A significant increase in Token usage and a substantial expansion of AI's problem-solving boundaries. The direct result of the demand explosion is the continuous tension and comprehensive price hikes in the supply chain, ultimately leading to consecutive upward revisions in cloud vendors' capital expenditures.
Especially since 2026, the accelerated implementation of the fourth paradigm has moved "Work Agents" from concept to reality, significantly speeding up the penetration of AI into core enterprise workflows.
According to data from the US Census Bureau, the AI penetration rate among US enterprises has risen rapidly from less than 5% at the end of 2023 to approximately 20% in mid-2026. Clearly, AI has become a once-in-decades heavyweight technological revolution.
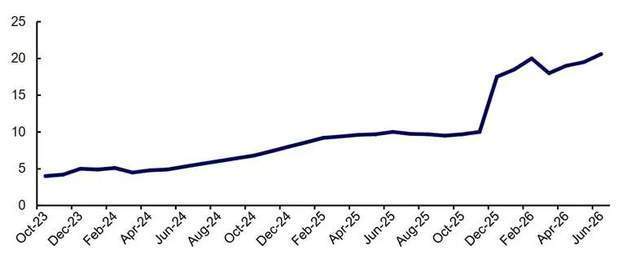
Figure: US Enterprise AI Penetration Rate Source: US Bureau of Statistics, CITIC Securities
Placed on a macro scale, is the magnitude of this AI investment reasonable?
The current global GDP total is approximately $118 trillion, with AI investment in 2026 around $1 trillion, accounting for less than 1% of the global total GDP intensity. Assuming global GDP reaches $130 trillion in 2030, with IT spending reaching 3% (the US previously had IT spending accounting for 6% of GDP), and half of IT spending going to AI, then AI capital expenditure can be calculated as $4 trillion.
Since this round is led by North America, another perspective is to look only at the investment intensity in the US. The US GDP is $38 trillion, and the current proportion of AI capital expenditure to GDP is around 2%. Referring to historical infrastructure cycles—UK railway investment peaked at around 6% of GDP, and US railway investment reached 3-4% of GDP—there is still significant room for more than doubling the AI investment proportion.
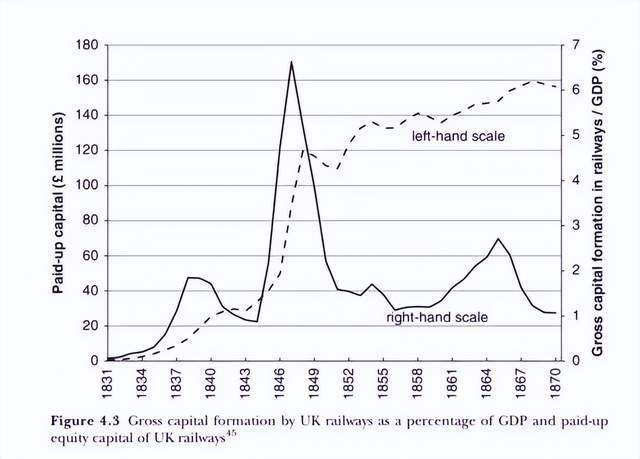
Figure: During the UK Railway Bubble, capital expenditure once reached 6-7% of GDP Source: Huatai Research
These calculations point to a common conclusion: From a macro total perspective, $3-4 trillion in AI capital expenditure is not an entirely unfeasible assumption.
But macro-level "feasibility" does not equal micro-level "realizability".
02
How is Revenue Visibility? $3 Trillion Certain and $7 Trillion Pending
Investment ultimately needs revenue support.
Based on historical empirical laws, it can be assumed that the capital expenditure intensity (Capex/Revenue) of the AI industry during peak periods is 35%. Thus, $3-4 trillion in capital expenditure implicitly requires the AI industry to achieve $8-10 trillion in annualized revenue.
What kind of concept is this? A simple comparative analysis can be done:
○ In 2025, the combined revenue of North America's Mag 7 was approximately $2.2 trillion. $8-10 trillion is equivalent to creating nearly 5 more Mag 7s.
○ If expanded to the S&P 500, its total operating revenue in 2025 was approximately $19 trillion. AI would need to create at least half of the S&P 500.
○ Nearly $10 trillion in revenue, assuming similar to other information technology industries where 50% of revenue can be converted into GDP, we calculate that by 2030, the AI industry's share of global GDP will be approximately 3-6%. This is equivalent to creating a new automotive + pharmaceutical industry, meaning AI needs to walk the path of two century-old industries in 10 years.
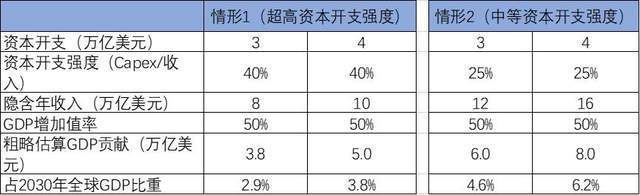
Table: AI Industry Share of GDP Source: Estimated by Jinduan Research Institute
With such a huge expected revenue volume, how much is currently "visible"? From the business models that have already been proven, there are mainly three paths.
The first is Cloud (API) services.
This is currently the clearest path and the most certain track to realize, meaning AI significantly increases the motivation and payment ceiling for enterprises to go to the cloud. Approximately 70-80% of Anthropic's revenue comes from API calls, which also confirms the core position of cloud-side monetization.
Estimates of AI-related revenue growth for major North American cloud vendors from 2026-2030 show that Amazon is expected to grow by approximately $200 billion, Google by $300 billion, Microsoft by $200 billion, plus other new cloud vendors by approximately $200 billion, totaling approximately $900 billion in revenue space, i.e., a trillion-dollar track.
The second is Personal Subscriptions (To C).
The US market, represented by OpenAI, Anthropic, etc., has generally established a starting threshold of $20 per month for the "AI tax" on the consumer side.
If the number of paying users globally reaches 2 billion, basic subscriptions alone correspond to approximately $500 billion; adding advertising and other ancillary services, the total C-end space of approximately $1 trillion is not unrealistic. However, the uncertainty of this track lies in user willingness to pay and retention rates, as well as differences in payment ability across different regions.
The third is Programming (Coding).
This is the vertical track with the highest current attention and strongest certainty of monetization. The reason the Coding track is easier to monetize is that users are high-paid knowledge workers, tools are deeply embedded in the development process, the paying entity is corporate R&D budgets rather than individual consumers, and results are quantifiable.
Globally, there are approximately 50 million programmers with an average annual salary of $50,000. If 40% of work is replaced or enhanced by AI, it corresponds to a market space of approximately $1 trillion.
Summing up the three tracks of cloud services, C-end, and coding, it corresponds to approximately $3 trillion in foreseeable revenue. This is the part with the highest market consensus and clear data support. But compared to the $10 trillion goal, there is still a gap of about $7 trillion. It is actually unclear what scenarios will generate this.
Third-party research cannot calculate higher numbers either.
Bloomberg Intelligence revised the long-term market size of generative AI from $1.8 trillion to $2.3 trillion in 2026, and provided a detailed revenue breakdown for 2032: Infrastructure near $600 billion, Devices and Applications (Inference) $730 billion, Inference/Fine-tuning Cloud Workloads $191.9 billion, LLM Licensing Revenue $120 billion, Chatbots/AI Agents $310 billion, Customer Service/Contract Review AI Agents $210 billion, Generative AI-driven Advertising Spend $210 billion, IT Services $80 billion, Workload Monitoring Software $80 billion.
HSBC predicts global AI industry revenue of $920 billion in 2030, of which B2B accounts for $708 billion; Jefferies calculates the global enterprise AI TAM excluding China to be $1.4 trillion in 2030.
More importantly, looking at current US penetration rates, professionals in high-tech industries such as information services, financial insurance, technical services, and enterprise management use generative AI at the highest rates, all exceeding 60%; while penetration rates in more traditional industries such as public administration, entertainment and leisure, accommodation and catering, and transportation are all below 30%.
According to Anthropic's research, for industries such as management, business and finance, computer and mathematics, the theoretical penetration rate of AI can exceed 80%; but for industries such as production, manufacturing and maintenance, and agriculture, the theoretical penetration rate is less than 20%.
This means that for AI to find new trillion-dollar tracks, it must continue to dig deeper in high-tech industries while breaking through the penetration bottleneck in traditional industries—the latter obviously faces greater challenges in the short term.
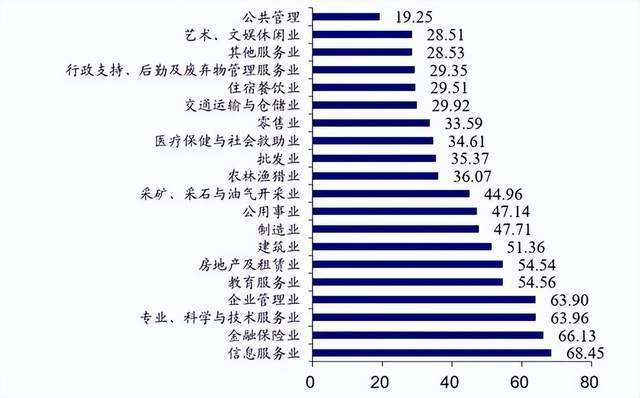
Figure: AI Usage Ratio of Employees in Various US Industries Source: Guotai Haitong Securities
03
Stones from Other Hills: What Are the Historical Coordinates for Capital Expenditure Intensity?
Since both total volume and revenue have huge uncertainties, from a financial perspective, how do we judge whether the current capital expenditure intensity of cloud vendors is reasonable?
To judge whether current AI capital expenditure is reasonable, one cannot just look at absolute values, but more importantly, the relative level of capital expenditure intensity (Capex / Revenue). By benchmarking against different types of heavy-asset industries, we can more clearly locate the current cycle stage of AI.
Historically, industries with high capital expenditure intensity can be roughly divided into two categories:
The first category is "Heavy Asset Network-type Industries," typical examples include railways, power grids, and telecom operators. Their common characteristic is that investment comes before revenue. Only when network coverage enters a mature stage does the capital expenditure intensity fall, and free cash flow and profit margins begin to improve and realize.
Telecom is a typical case: During the peak period of 5G and computing network investment by China's three major operators from 2021-2023, Capex/Revenue was as high as 20%-24%, dropping to below 18% in recent years; European telecom saw a peak of about 20% in 2021/2022, gradually falling to within about 15% by 2026.
Grid intensity is slightly lower. Taking China as an example, State Grid and China Southern Power Grid have a combined annual revenue of approximately 5 trillion yuan, with capital expenditure of approximately 750 billion yuan, capex/revenue about 15%. These tracks basically anchor an intensity of 15%-25%, making it difficult to go much higher.
The second category is "Technology Iteration-driven Industries," which maintain relatively high investment intensity, typical examples including semiconductor foundries, cloud computing, lithium batteries, and storage.
Their investment peak periods might instead occur when demand is extremely strong, capacity utilization is high, and product generations are leading, resulting in a coexistence of "high Capex intensity + high profit margins." TSMC is the most extreme case: During the last round of capital expenditure intensity peak in 2021-2022, Capex/Revenue reached around 50%, but operating profit margin remained near 50%; after capital intensity fell back to about 33% in 2024-2025, profit margins continued to rise.
AWS's historical data is also typical: Capital intensity was roughly between 27%-33% from 2018-2023. After entering the AI investment period, capital intensity rose even further to above 40%.
CATL in lithium batteries also has some reference significance. When products were leading, its capital expenditure surged, with Capex/Revenue reaching a high of 26.4%-33.6% from 2020-2022, followed by a rapid decline accompanied by positive cash flow and rapid improvement in profitability.
Storage manufacturers (SK Hynix, Micron) are the most cyclical among these high-tech products, but their investment intensity averages around 30%.
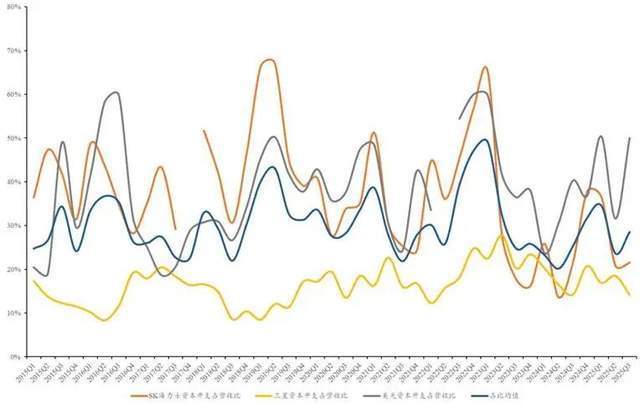
Figure: Storage Factory Capital Expenditure Intensity Source: Wind
The AI industry is like railway operators in that investment comes before harvest, and like semiconductors and other high-tech industries, capital expenditure intensity is linked to product capability. Therefore, synthesizing these historical coordinates, we can draw a relatively objective conclusion: A capital expenditure intensity in the range of 15%-40% is a reasonable assumption.
If benchmarking against heavy asset industries like cloud operators, railways, and power grids, the steady state is about 15%, peaking close to 25%; if benchmarking against strong cyclical industries like wafer foundries, internet bubbles, and storage, the average is 20%-30%, with peaks reaching 40%+.
The current capital expenditure intensity of the AI industry is at the upper end of this benchmarking range. With a total investment of $1 trillion and visible revenue of $3 trillion, the corresponding investment intensity has already reached 30%. There is indeed little room for further upward revision in the short term, let alone the previous doubling.
04
How Long Can the Cloud Vendors' Ammo Reservoir Last?
Capital expenditure ultimately falls on the question of "where does the money come from?" So another facet of the current narrative is, as the main force of AI investment, how long can the ammo of the Big Four North American cloud vendors last?
The first layer is internal cash flow. Based on current operational trends, the combined operating cash flow of cloud vendors in 2027 can support approximately $860 billion in capital expenditure; assuming another growth of approximately $200 billion in 2028, the internal limit is approximately $1.1 trillion.
External financing provides the second layer of ammo: On the bond market side, the five major cloud vendors have cumulatively issued corporate bonds of approximately $300 billion since 2025; on the equity market side, this year we have seen Google's $80 billion equity financing plan, and SpaceX has also completed the largest IPO in US stock history, with some investments directed towards AI.
The third method is "circular financing"—Nvidia invests in AI startups like xAI, OpenAI, startups commit to cloud spending, cloud providers purchase Nvidia hardware, and Nvidia recognizes revenue. The fragility of this model lies in the fact that cash has never completed a true commercial cycle, so it all relies on the listings of Anthropic and OpenAI to fill this hole, and ultimately requires AI terminal applications to take off.
Summing up the above channels, a relatively objective extreme calculation is: Operating cash flow of approximately $1 trillion, reasonable borrowing space close to $1 trillion, collectively supporting approximately $2 trillion in capital expenditure.
Simultaneously assuming the four major vendors account for 50%-60% of global capital expenditure, this corresponds to a global AI total investment of approximately $3-4 trillion.
Calculating to here, it is not hard to discover that the capital expenditure scale mentioned at the beginning can be "calculated and summed up" bottom-up by enterprises, but this magnitude basically touches the upper limit of imagination.
Recently, this dream has already developed cracks: 1) SpaceX and Meta's 加码 on computing power, due to the lack of their own cloud business support, belongs more to a strategic choice of "betting on themselves," and under sustained high pressure, they have started transforming into computing power leasing and cloud services to share some cost pressures; 2) Recent media reports stated that Nvidia management is discussing providing approximately $250 billion in financing guarantees for OpenAI's Ohio data center project, further deepening market concerns.
05
Conclusion: Upward AI Trend and Expectation Management for the Hardware Chain
There is no problem with the long-term trend of the AI industry, but capital expenditure cannot be extrapolated infinitely. Looking at the investment intensity of historical technological revolutions, industry capital expenditure patterns, and corporate financial capabilities from three dimensions, a high investment of $3-4 trillion is a somewhat extreme scenario, not necessarily reached, and certainly not seen in the short term.
In the process of the above logical deduction, it is not difficult to find that the story of North American cloud vendors' AI capital expenditure is shifting from faith to accounting, among which AI hardware will be the first to face tests.
In 2025, the rise of the AI hardware industry chain was entirely driven by fundamentals; but entering the first half of 2026, the pace was obviously too fast, driven more by panic expectations of "surging demand and comprehensive price hikes across the entire industry chain."
Summing up the plans of various cloud vendors and sovereign institutions from the bottom up, next year's total AI capital expenditure is approximately $1.2-1.5 trillion. But if reverse-calculated based on the expected guidance of core hardware such as GPUs and optical modules, the market's expectation for total capital expenditure may be above $1.5 trillion.
This means North American cloud vendors still need to significantly revise up their capital expenditure, which also explains why Google's earnings report clearly revised up capital expenditure, yet the global hardware market continued to decline.
A more critical issue is that when the market's expectation for next year's capital expenditure is already as high as above $1.5 trillion, an unavoidable reality is: The space for further upward revision in the long term is narrowing.
Although from a total volume perspective, an investment scale of $3-4 trillion can be anchored at the macro level; the arguments on both the industrial supply and demand sides are weak.
From the demand side, the four rounds of paradigm shifts and the implementation of Agent technology do support the long-term narrative of continuous demand expansion; but from an industry perspective, currently only about $3 trillion in revenue has relatively clear visibility, and the remaining $7 trillion requires AI to achieve penetration breakthroughs in more traditional industries, which is not something that can be realized in the short term.
From the supply side, the vision of $3-4 trillion in investment faces two hard prerequisites: First, cloud vendors' cash flows must see significant growth to support sustained high-intensity capital expenditure; Second, non-North American cloud vendors must also accelerate investment, such as Sovereign AI and China's domestic AI investment.
In short, the valuations of many hardware companies currently imply expectations of extremely high capital expenditure in 2027. Once core players in North America slow down their capital expenditure pace due to cash flow pressure or strategic adjustments, market expectations will face major corrections.
The relatively objective conclusion now is: $1.2-2 trillion in AI capital expenditure is indeed foreseeable, with little divergence; the distant $3-4 trillion can indeed be calculated, but requires extreme conditions to achieve.
For investors, the important thing is no longer debating whether the AI revolution is real, but soberly recognizing: When an investment frenzy hits the ceiling, expectation management will be more important than demand forecasting.
The copyright of this article belongs to the original author/organization.
The views expressed herein are solely those of the author and do not reflect the stance of the platform. The content is intended for investment reference purposes only and shall not be considered as investment advice. Please contact us if you have any questions or suggestions regarding the content services provided by the platform.
