


SpaceX (NASDAQ: SPCX): First earnings report after listing beats expectations across the board, yet stock closes at its lowest point since IPO
Revenue exceeded Morgan Stanley's expectations by 16%, adjusted EBITDA by over 75%, and operating losses narrowed from the expected $1.68 billion to $143 million—but single-quarter capital expenditures reached $18.37 billion, equaling 2.35 times that quarter's revenue, with the company guiding for this pace to continue each quarter in the second half of the year. The controversy is not about "whether this quarter was good or bad," but rather "whether this is a necessary overdraft before computing power capacity materializes, or a bill that will ultimately have to be paid with equity."
I. Core Judgment
The market should have breathed a sigh of relief seeing "the first earnings report after listing showing all three lines beating expectations," yet SPCX fell 13.61% on August 5 to $108.27, marking its lowest closing price since its June 12 listing. The gap here is the key to understanding this company: In Q2 2026, what was never sold was performance, but the slope of capital expenditures. Revenue for the quarter was $7.814 billion, up 92% year-over-year, exceeding Morgan Stanley's expectations by 16%; adjusted EBITDA was $3.538 billion, exceeding Morgan Stanley's expectations by 75%; operating losses were only $143 million, $1.54 billion less than the $1.683 billion expected by Morgan Stanley. However, in the same earnings report, single-quarter capital expenditures were $18.369 billion—2.35 times that quarter's revenue, with AI alone accounting for $15.828 billion, equivalent to 6.2 times the division's revenue and 21 times year-over-year; CFO Bret Johnsen stated on the call, "capital expenditure levels for the next two quarters will be very close to this quarter." What best illustrates the issue is Morgan Stanley's own action: it raised its 2026/27 revenue forecasts from $44.9/$90.9 billion to $48.0/$102.3 billion, and EBIT from $5.4/$29.2 billion to $7.6/$34.0 billion, yet the target price remained unchanged at $300, as stated in the report—the profit increase was completely offset by the capital expenditure increase (2026 capex $48.1→$63.7 billion, 2027 $128.8→$163.2 billion). Every extra dollar earned was eaten up by more than two extra dollars spent.
Directionally, let's lay out the facts clearly: revenue $7.814 billion, up 92% YoY; all three divisions accelerated simultaneously—Space $962 million (up 29% YoY, 55% QoQ), Connectivity $4.291 billion (up 66%/32%), AI $2.561 billion (up 247%/213%). Gross margin derived is 55.3%, an increase of 11.4 percentage points from 43.9% in the same period last year; adjusted EBITDA margin is 45.3% (29.8% YoY); net loss narrowed to $541 million. Operational metrics are equally solid: Starlink users reached 12 million, doubling YoY and adding 1.7 million net QoQ; nameplate compute capacity is 1.4 GW (1.0 GW in 1Q26, 0.4 GW in 2Q25); the company signed $14.1 billion in new cloud service contracts this quarter, recognizing $1.6 billion in incremental revenue in the same quarter; Starship's 13th flight on July 24 achieved all objectives, deploying 20 production-model V3 Starlink satellites, achieving reignition of in-orbit Raptor engines, and capturing the first complete images of heat shields. There were no soft spots in this earnings report.
Rhythmically, this is a moment of misalignment where "fundamentals are accelerating while the stock price is breaking down." The IPO offering price was $135, hitting an intraday high of $225.64 on June 16 and an intraday low of $104.83 on August 3; the day before the earnings report (August 4), the stock surged 9.4% to $125.33, falling 13.61% on the day of the report, then rebounding 6.14% on August 6 due to the smooth absorption of the first batch of unlocks, closing at $114.92. Based on the August 6 closing price and total shares outstanding of 13.176 billion, the market cap is approximately $1.51 trillion; cash and securities on hand are $100 billion, interest-bearing debt and finance leases are $39.36 billion, net cash is approximately $60.6 billion, corresponding to an enterprise value of approximately $1.45 trillion. At forecast levels, this equates to 30.3x 2026 EV/Revenue, 14.2x 2027 EV/Revenue, 22.6x 2027 EV/Adjusted EBITDA, and 19.6x 2028 EPS. At the same price, looking at different years' metrics makes it look like two completely different stocks—this is precisely why sell-side target prices range from $115 to $800.
Structurally, two variables determine the stock price over the next 6–12 months, neither of which appears on the income statement. The first is whether unit compute revenue (Rev/Watt) will collapse—Morgan Stanley's 2027 model assumes total revenue/watt drops from ~$31 in 4Q26 to ~$17 in 4Q27 (pricing normalization after compute supply shifts to loose), and it is exactly this assumption that makes their $102.3 billion 2027 revenue forecast nearly zero growth relative to the company's own "$100 billion ARR by end of 2026"; Morgan Stanley explicitly wrote that if $31/watt is maintained and run at an average of 3.5 GW compute, 2027 revenue would need to add another ~$42 billion. One assumption, a 41% swing in revenue. The second is mismatch between financing methods and unlock rhythms—1H26 operating cash flow was $3.466 billion, capital expenditures $28.476 billion, leaving a semi-annual free cash flow gap of approximately $25 billion (self-calculated); Morgan Stanley's model shows 2027 free cash flow at -$104.5 billion, while JPMorgan sees capital expenditures for both 2027 and 2028 nearing $200 billion each. $100 billion in cash can get through 2026, but not 2027; and tiered unlocks extend all the way to the end of 2026, with Elon Musk's own 6 billion+ shares not unlocking until June 2027, meaning the financing window coincides exactly with the period of heaviest supply.
What is earned is money priced by the market under the worst-case scenario for the time lag between "capital expenditure becoming compute, and compute becoming revenue"—the company has already proven it can turn GW-level compute into revenue (AI revenue up 213% QoQ), what the market doubts is merely the slope and cost of this curve; the risk is that this time lag must be cushioned by its own balance sheet, and if unit compute revenue halves as expected in 2027 while the unlock wave suppresses the stock price, the company will have to do equity financing at a suppressed price—that is the true path to falsifying this story.
II. What Happened This Quarter: Three Divisions Give Readings Simultaneously for the First Time
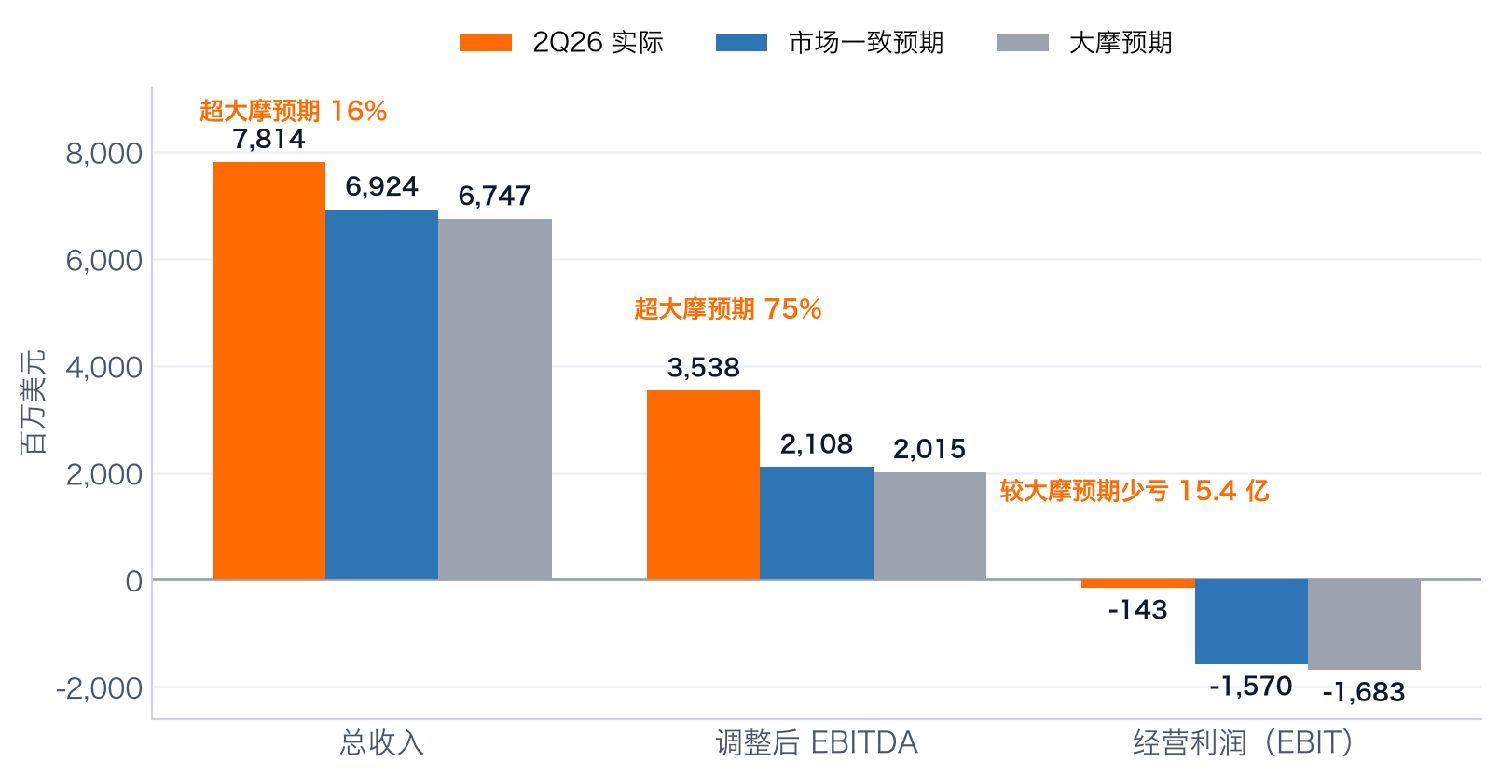
Figure 1: Q2 2026 Actual vs Consensus vs Morgan Stanley Estimates (Million USD) Data Source: SpaceX Q2 2026 Earnings Report, Visible Alpha/FactSet Consensus, Morgan Stanley
This is SpaceX's first report card as a publicly listed company; the market previously had no quarterly rhythm to reference, so the signal strength of all three lines beating expectations should have been high: revenue of $7.814 billion beat consensus by $890 million and Morgan Stanley by $1.07 billion; adjusted EBITDA of $3.538 billion beat consensus by $1.43 billion and Morgan Stanley by $1.52 billion; operationally, losses narrowed from expected -$1.57 to -$1.68 billion to just -$143 million. R&D expenses were $3.548 billion, accounting for 45.4% of revenue, lower than the consensus estimate of 44.34%—while revenue skyrocketed, the absolute amount of R&D was $890 million less than the market thought.
Division (Million USD) | Q2 2026 Revenue | YoY | Operating Profit | Margin | Adj. EBITDA | Quarterly CapEx |
Space (Launch) | 962 | +29% | (542) | -56.3% | (205) | 1,174 |
Connectivity (Starlink) | 4,291 | +66% | 1,656 | +38.6% | 2,597 | 1,367 |
AI (Compute/Grok/X) | 2,561 | +247% | (1,257) | -49.1% | 1,146 | 15,828 |
Total | 7,814 | +92% | (143) | -1.8% | 3,538 | 18,369 |
Looking at the three divisions separately, this company is essentially a highly profitable business subsidizing two businesses that are still burning cash. Starlink is the only cash cow: $4.291 billion in revenue, $1.656 billion in operating profit, 38.6% operating margin; divisional EBITDA of $2.597 billion minus $1.367 billion in capital expenditures still results in a positive net outflow of $1.23 billion (self-calculated). Its growth quality is also improving—enterprise and government revenue was $1.806 billion, up 108% YoY and 63% QoQ, growing much faster than the consumer segment's 44%; it secured a major deal with American Airlines this quarter and launched services on Southwest Airlines, Virgin Atlantic, and Aer Lingus, along with over $6 billion in multi-year US government contracts for Starshield (primarily from two Low Earth Orbit communication and remote sensing constellation contracts from the Space Force). The Space division generated $962 million in revenue and lost $542 million, with the loss stemming from $1.076 billion in R&D—up 55% YoY, almost entirely poured into Starship. The AI division generated $2.561 billion in revenue and reported an operating loss of $1.257 billion, but incurred $15.828 billion in capital expenditures.
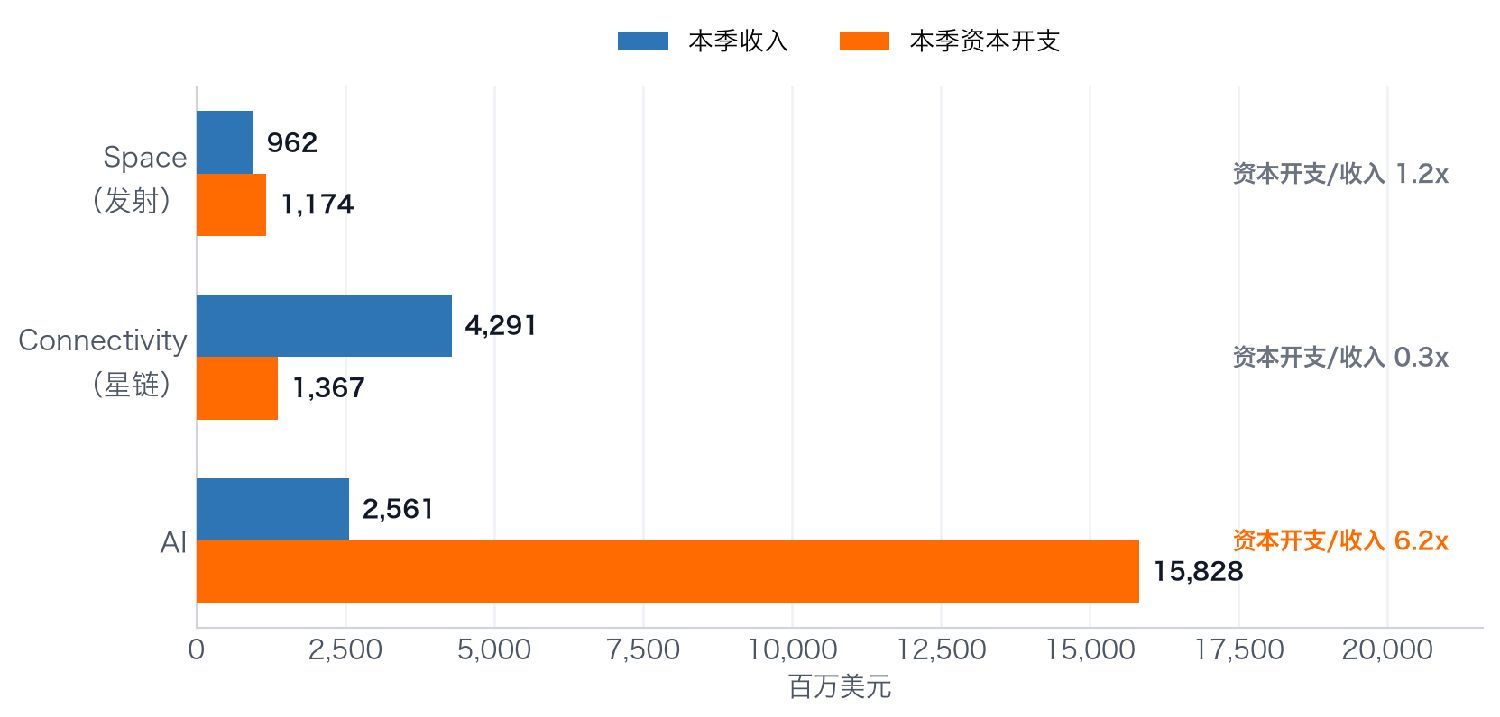
Figure 2: Q2 2026 Divisional Revenue vs Divisional Capital Expenditures (Million USD) Data Source: SpaceX Q2 2026 Earnings Report
One soft point worth highlighting individually is Starlink ARPU: $66/month this quarter, flat from 1Q26, but 22% lower than the $85/month in the same period last year. The company's explanation is entering more international markets and a rising proportion of low-price plans, which makes logical sense (user count doubled in the same period), but the model assumes ARPU will continue to drop—$60.82 in 2026 and $51.88 in 2027. That is, Starlink's revenue growth for the next two years is assumed to be purely "volume for price": users increasing from 12 million to 28.82 million (+140%), while ARPU drops from $66 to $51.88 (-21%). Whether this combination can hold simultaneously is what needs to be verified quarter by quarter for Starlink; the high growth in enterprise and government revenue (+108%) acts as a hedge, because the pricing logic for this segment is completely different from the consumer side.
III. Capital Expenditures: The True Protagonist of This Earnings Report
Single-quarter capital expenditures of $18.369 billion are the only number in this earnings report that is "more extreme than the market anticipated," and they are the sole reason for the stock's 13.6% single-day drop. It represents a year-over-year increase of approximately 550% (from $2.825 billion in the same period last year), with AI alone surging from $749 million to $15.828 billion. More critically, regarding forward guidance: the CFO explicitly guided that capital expenditures per quarter in the second half will be comparable to this quarter, implying approximately $36.7 billion for 2H26 and roughly $65 billion for the full year (self-calculated, as the company did not provide a full-year figure), which aligns basically with Morgan Stanley's revised model of $63.7 billion.
Metrics Here lies a divergence that must be pointed out—whether "capital expenditures beat or missed expectations" depends on whose consensus you use. CNBC cited FactSet metrics stating market expectations were $13.22 billion, making $18.369 billion a significant overspend; Business Insider cited Bloomberg metrics stating market expectations were $18.58 billion, making $18.369 billion slightly lower. Neither was wrong; buyers themselves lacked a unified expectation. The only uncontroversial item is the AI component: $15.828 billion vs. Bloomberg's $13.09 billion, beating by approximately $2.7 billion—the market reacted precisely to this number. |
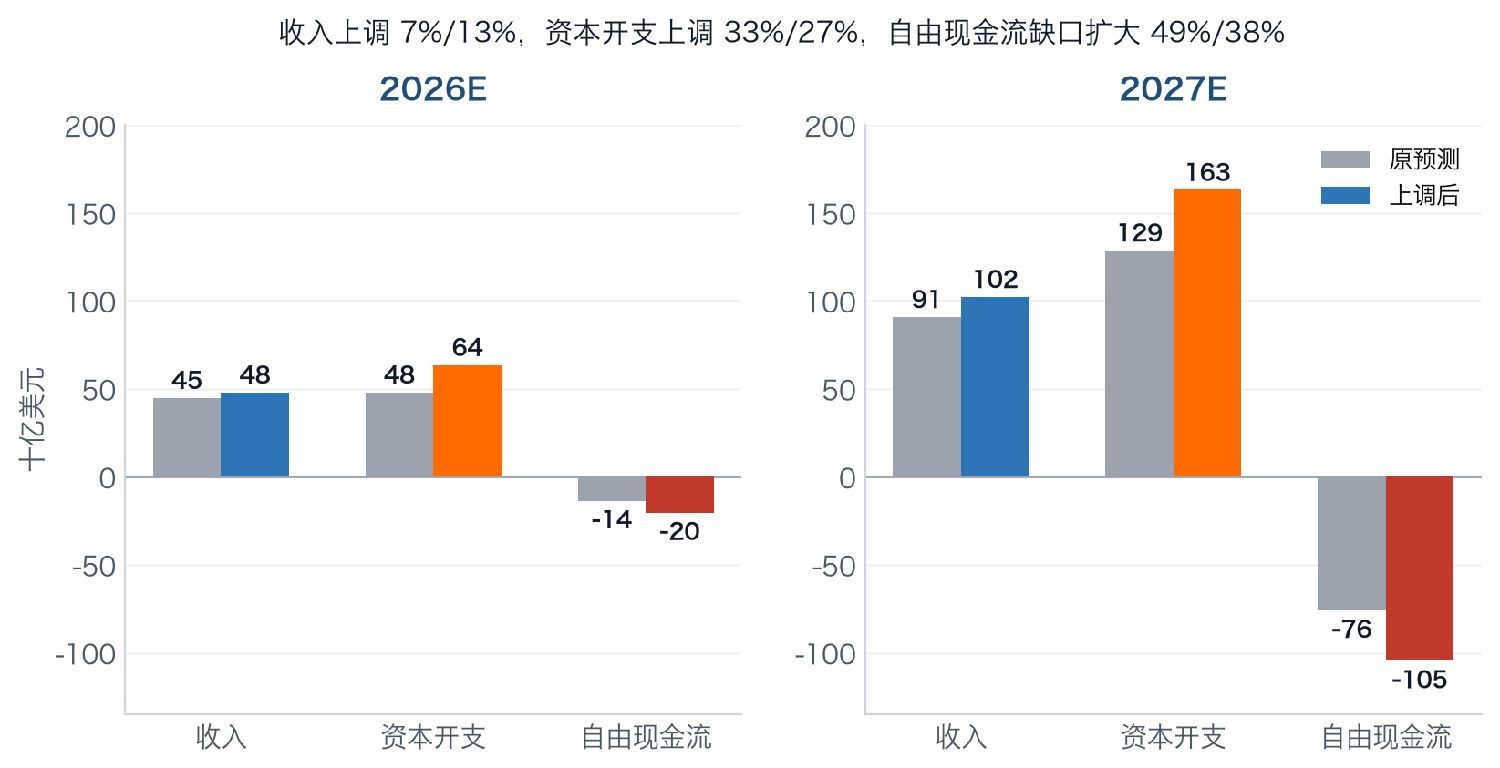
Figure 3: Morgan Stanley's Forecast Revisions for SpaceX: Revenue Upward Revision, Eaten by Capital Expenditures (Billions of USD)
Morgan Stanley's revision actions this time carry more information than its conclusions. It raised 2026 revenue by 6.8% and 2027 revenue by 12.5% (almost entirely from the AI division: 2027 AI revenue increased from $55.8 billion to $66.8 billion, +19.6%); it raised 2026 EBIT by 41% and 2027 EBIT by 16%; gross margin, EBITDA margin, and divisional margins were all upgraded. In a report where profits were almost universally upgraded, the target price did not move by a single cent. The reason lies in the two bars on the right: 2026 capital expenditures were raised from $48.1 billion to $63.7 billion (+32.5%), and 2027 from $128.8 billion to $163.2 billion (+26.7%), widening the free cash flow gap correspondingly from -$13.6 billion to -$20.2 billion, and from -$75.9 billion to -$104.5 billion. This is the most important sentence for understanding current SPCX pricing: The sell-side is upgrading its income statement while downgrading its cash flow statement, and the market currently assigns higher weight to the cash flow statement.
This weight shift is not unique to SpaceX. In the same earnings season, Alphabet, Meta, and Tesla were all sold off for raising AI capital expenditure guidance. SPCX's uniqueness lies in two points: its capital expenditure/revenue ratio is 2.35 times, far higher than any other hyperscale cloud vendor (these companies typically fall in the 0.3–0.6 times range); and it does not yet have a mature compute business capable of self-sustaining cash flow generation—AJ Bell's Russ Mould put it accurately on CNBC: "A significant difference between SpaceX and other big spenders in the AI arms race is that it has not yet generated meaningful cash flow." The company's rebuttal comes from a sentence by the CFO on the call: "Not all capital expenditures are the same. Specifically on the AI compute side, our deployment method allows for a payback period of less than one year." If this "one-year payback" is true, a 2.35x capital expenditure/revenue ratio is not a black hole but leverage; this statement itself cannot be falsified externally, but it will be confirmed or refuted by the 2027 revenue curve.
IV. Three Metrics That Must Be Seen Through
The AI division's "first positive adjusted EBITDA" is added back. "The AI division achieved a positive adjusted EBITDA of $1.146 billion" reads as if the compute business is starting to make money. Breaking it down: the AI division had an operating loss of -$1.257 billion; adding back depreciation and amortization of $1.885 billion, stock-based compensation of $516 million, and restructuring costs of $20 million yields +$1.146 billion. That is, this $1.146 billion comes 100% from the add-backs of depreciation and stock-based compensation; the AI division still operates at a loss of $1.257 billion on an operating profit basis. For a business that is essentially "depreciating capital expenditures and then selling them off," EBITDA is precisely the metric least suited for use—it wipes out the only real cost item of this business. And depreciation will only accelerate: consolidated depreciation and amortization reached $2.848 billion in Q2 2026, up 87% YoY; net fixed assets grew from $42.6 billion to $65.7 billion in half a year; extrapolating backwards using Morgan Stanley's own model, D&A will rise from approximately $13.3 billion in 2026 to approximately $26.1 billion in 2027, nearly doubling.
"$100 billion ARR by end of 2026" is not revenue, and includes an acquisition that has not yet closed. This was the most eye-catching sentence on the call, and also the one requiring the clearest definition. First, it is Annualized Run Rate (ARR), not annual revenue—the full-year 2026 revenue forecast is only $48 billion; second, CNBC reported that this target includes the contribution from Cursor, and the $60 billion acquisition of Cursor is expected to close in the third quarter, pending regulatory approval, with Elon Musk refusing to elaborate on the call citing regulatory reasons. Third, it is indeed significantly higher than previous expectations—Morgan Stanley's previous 4Q26 revenue forecast was $1.91 billion (annualized approx. $7.6 billion); $100 billion ARR implies a significant step up; the CFO added that they signed another $6.7 billion in cloud service contracts in the first few weeks of the third quarter, ramping up starting in October. But the most intriguing aspect is that Morgan Stanley didn't fully believe it: its 2027 revenue forecast of $102.3 billion, relative to the $100 billion ARR export at the end of 2026, equals an assumption of zero acceleration for the full year. This conservatism is proactive, written into the report, and is precisely the assumption discussed in Section V.
Per-share numbers are non-comparable starting from the third quarter. Q2 2026 per-share loss was $0.09, better than the consensus estimate of $0.24–$0.26; this beat is real (net loss $541 million vs. implied consensus of approx. $1.69 billion). However, weighted average shares outstanding were only 5.864 billion, because the IPO closed on June 15 and preferred shares converted concurrently; actual total shares outstanding on June 30 were 13.176 billion (Class A 7.607 billion + Class B 5.569 billion), which is 2.2 times the weighted number. Morgan Stanley's model assumes fully diluted shares of 9.771 billion for all of 2026 and 14.212 billion for 2027. By the way, a detail: Morgan Stanley raised its 2027 fully diluted share assumption from 12.80 billion to 14.21 billion (+11%); the report does not explain where these 1.4 billion shares come from, but conversion consideration from the Cursor deal and subsequent financing are possible sources—if the latter, that means equity financing is baked into the model. Additionally, attributable net loss to shareholders in 1H26 was $5.488 billion, higher than the net loss of $4.817 billion; the difference of $671 million is related to preferred stock appreciation/deemed dividends, not operating losses.
V. Unit Compute Revenue: The Assumption Supporting 2027
If you can only watch one number, it is Rev/Watt (unit compute revenue). This variable determines the glaring "zero acceleration" between $100 billion ARR and $102.3 billion in 2027 revenue.
The divergence in compute ramp-up itself is large enough. The company guides for nameplate compute to exceed 2 GW by the end of 2026, but Musk's original words for the end of 2027 were "our cumulative online compute by next year might be several times what it is now, for example, closer to 10 GW than 5 GW"—Morgan Stanley took only the lower bound of the range at 4.94 GW, higher than the market's previous 4.15 GW, but only half of the upper bound of the guidance. Musk additionally mentioned "tentative targets" for power and cooling layers of 20 GW by the end of 2027, while also saying "I don't think we can achieve 20 GW," with actual expectations around 15 GW—this is supporting infrastructure metrics, not commercially available compute metrics; the two cannot be mixed.
The real leverage is on the price side. Morgan Stanley explicitly stated: it assumes total revenue/watt drops from ~$31 in 4Q26 to ~$17 in 4Q27,理由是 "pricing normalization after the compute market becomes more saturated"; it is exactly this assumption that causes 2027 revenue to show almost no growth relative to the end-of-2026 ARR export. Meanwhile, it provided a counter-scenario—if $31/watt is maintained, running at an average of 3.5 GW compute in 2027, it would bring approximately $42 billion in incremental revenue for 2027, lifting the $102.3 billion to approximately $144.3 billion (+41%). Same model, same report; one price assumption creates a $42 billion swing, which determines the stock price more than any divisional operational detail.
Both sides of this assumption have realistic basis. On the bearish side: 2027 is the year when industry-wide compute capacity comes online en masse; supply easing leading to downward rental price trends is a reasonable deduction, and pricing protections on signed contracts are limited—SpaceX disclosed in its prospectus-related documents that its cloud service agreement with Google can be terminated by either party with 90 days' notice after December 31, 2026, which is exactly what Piper Sandler called "contract amounts are considerable but cancellable, making it hard to judge stickiness." On the bullish side: the company's definition of "contract sales" is inherently conservative—News Release Note 2 states that the $14.1 billion in contract sales only counts amounts during non-cancellable, enforceable periods, excluding any future periods cancellable by either party; in other words, this $14.1 billion is firm. Additionally, Musk said two things on the call favorable to pricing: SpaceX decided to exclusively adopt NVIDIA GPUs (due to bullishness on the Vera Rubin architecture), and stated that the tacit understanding with NVIDIA is to secure a very high proportion of its GPU supply next year; and memory output grows ~20% annually, demand grows ~200% annually, so memory prices will rise—if supply bottlenecks truly exist, compute rental prices may not collapse as Morgan Stanley assumes.
VI. Unlocks and Financing: A Temporal Mismatch
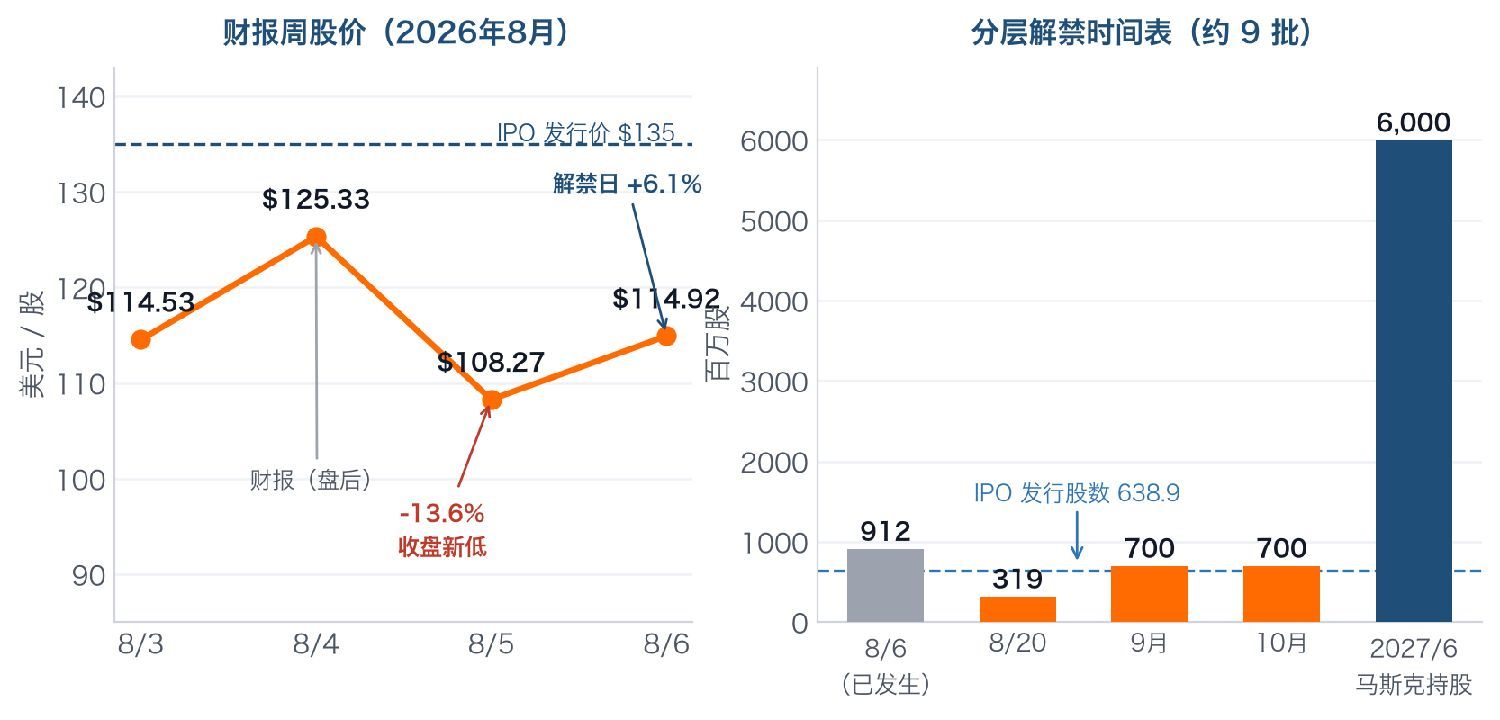
Figure 4: Stock Price During Earnings Week and Tiered Unlock Schedule Data Source: Nasdaq Quotes, SpaceX Prospectus, CNBC/Morningstar Compilation
SpaceX did not use the traditional one-time 180-day unlock, but designed approximately 9 batches of tiered rolling releases, aiming to spread out old shareholders' selling pressure rather than block it. The first batch occurred on August 6—the second full trading day after the earnings report—releasing 911.5 million shares, 43% more than the 638.9 million shares issued in the IPO, accounting for approximately 7% of total shares outstanding, instantly raising the public float from 4.9% to 11.8%, valued at approximately $98.7 billion based on the August 5 closing price. The result was the stock rose 6.14% that day. The reason is that it was digested in advance: JPMorgan wrote before the unlock, "We believe there has been substantial positioning ahead of the first unlock"; data from S3 Partners showed short interest once reached approximately 35% of the float, nominally about $26 billion; a significant portion of the August 6 rally consisted of short covering. Vanda Research observed retail investors heavily buying the dip after the earnings report, with net buying of $22.7 million in the first hour of trading on August 5, three times the normal volume for that period.
Timing | Release Size | Description |
2026-08-06 (Occurred) | Approx. 911.5 million shares | First batch, approx. 7% of total shares; Float 4.9%→11.8%; Stock price +6.14% that day |
2026-08-20 | Approx. 319 million shares | One of the tiered batches stipulated in the prospectus |
September 2026 | Approx. 700 million shares | Includes a batch released after the Q3 report (approx. 28% tranche) |
October 2026 | Approx. 700 million shares | Last few batches before 180 days post-listing |
June 2027 | Over 6 billion shares | Elon Musk and certain key investors' 366-day hard lock expires |
Overlaying the unlock schedule with the funding gap reveals the sharpest structural tension in this story. Funding side: 1H26 operating cash flow was $3.466 billion, capital expenditures $28.476 billion, leaving a semi-annual gap of approx. $25 billion (self-calculated); on-hand $100 billion cash plus the $25 billion investment-grade bonds issued in June (five tenors, weighted average coupon 5.855%), are more than sufficient to get through 2026. The problem lies in 2027: Morgan Stanley's model shows free cash flow at -$104.5 billion, while JPMorgan sees capital expenditures for both 2027 and 2028 nearing $200 billion each, explicitly stating "this will further suppress 2027 free cash flow, a trend we see across all hyperscale vendors." $100 billion in cash cannot cover a $104.5 billion gap; financing is inevitable, the only question remaining is form—continue issuing debt (net cash $60.6 billion, investment-grade rating, still room) or issue equity. And the window for issuing equity falls exactly during the densest unlock supply from Q4 2026 to mid-2027; Piper Sandler therefore stopped its rating at Neutral with a $140 target price, stating directly "valuation suppression from unlocks will persist until summer 2027".
VII. Brokerage View Comparison: Target Prices Range from $75 to $800
This is a rare stock where the sell-side is almost uniformly bullish, yet the dispersion in target prices approaches 7 times. Morgan Stanley's report statistics show the consensus target price distribution range is $115 to $800, with rating distribution 79% Overweight, 18% Neutral, 3% Underweight. Post-earnings adjustment directions are also not uniform—Goldman Sachs and JPMorgan raised target prices, Deutsche Bank and Piper Sandler lowered them, Morgan Stanley maintained theirs.
Institution | Rating | Target Price | vs Aug 6 Close | Core View |
Morgan Stanley | Overweight (Maintained) | $300 | +161% | Profit upgrade offset by CapEx upgrade, hence target price unchanged; Bull $600 / Bear $75 |
JPMorgan | Overweight | $240 (Raised) | +109% | Impressed by ARR trajectory; but expects 2027/28 CapEx each near $200B, further suppressing FCF |
Oppenheimer | Outperform (Maintained) | $250 | +118% | High CapEx is "primary concern," but brings $1T revenue timeline forward by approx. 3 years to 2032 |
Cantor | Overweight (Maintained) | $246 | +114% | Management outlook "excellent across all fronts"; implies healthy payback period, significant cash flow opportunity |
Bernstein | Outperform (Maintained) | $239 | +108% | Douglas Harned: "Nothing negative in the report," decline more likely due to unlock timing |
BofA | Buy (Maintained) | $235 | +105% | Expects AI division year-end revenue approx. $24.5B; acknowledges company disclosure and communication style |
Deutsche Bank | Buy (Lowered PT) | $235 | +105% | Long-term bull case intact, but warns CapEx may accelerate further in 2027 |
Goldman Sachs | Buy | $220 (Raised) | +91% | Divisional valuation discount; Bull $285; expects unlocks to bring more dispersed price discovery and continued volatility |
Piper Sandler | Neutral (Lowered PT) | $140 | +22% | Alexander Potter: Upgraded profits but lowered target multiple; unlock suppression lasts until summer 2027; Cloud contracts "considerable but cancellable" |
The focal point of divergence is actually quite concentrated; almost everyone agrees on fundamentals ("nothing negative in the report"), the divergence lies solely in whether to discount a balance sheet with negative cash flow and uncleared unlock supply, and by how much. Morgan Stanley's handling is the most honest—laying out the bull/bear ranges in the report: Bull $600 (Starship, orbital compute, Terafab accelerate realization, AI contributes >60% of valuation, compute deployment CAGR 50% before 2040), Bear $75 (Starship delayed until 2029 to become operational, AI monetization and deployment significantly below expectations, Space and Connectivity support approx. 90% of overall valuation). Calculated from the August 6 close of $114.92, the bear case still has -35% downside, the bull case has +422% upside. This odds structure itself indicates: the current price is neither pricing in the worst-case scenario nor even close to pricing in the best-case scenario; it trades the middle ground of execution capability.
VIII. Risk List and Key Observation Indicators
Risk / Observation Item | Trigger Line / Description |
① Collapse of Unit Compute Revenue (Most Critical) | MS assumes total rev/watt drops from ~$31 in 4Q26 to ~$17 in 4Q27; if actual drop is faster or customer renewal prices decline, 2027 revenue will be below $102.3B; conversely if maintained at $31/W, corresponds to approx. +$42B incremental. Watch Quarterly AI Revenue ÷ Avg Compute |
② 2027 Financing Method | 1H26 FCF gap already approx. $25B; MS 2027 FCF -$104.5B, JPM sees 2027/28 CapEx each near $200B. If equity financing done at lows before unlocks clear → direct dilution; Watch for new bond issuance or secondary offering announcements |
③ Cancellability of Cloud Contracts | Google agreement allows either party to terminate with 90 days' notice after 12/31/2026 (disclosed in SEC filings). $14.1B "contract sales" per company definition only includes non-cancellable portions, but disclosed total contract amounts far exceed this → Watch quarterly net increase in contract sales and renewals |
④ Tiered Unlock Supply | 8/20 approx. 319M shares, Sept & Oct approx. 700M shares each, Musk's 6B+ shares locked until June 2027. Smooth digestion of first batch does not guarantee subsequent ones; Watch volume and short interest ratios before/after each batch (S3 metrics once reached ~35% of float) |
⑤ Depreciation Erosion of Operating Profit | 2Q26 D&A already $2.848B, +87% YoY; Net Fixed Assets half-year $42.6B→$65.7B. MS model D&A rises from ~$13.3B in 2026 to ~$26.1B in 2027. If revenue ramp lags depreciation ramp → EBIT breakeven timing delayed |
⑥ Viability of Starlink "Volume for Price" | ARPU dropped from $85 to $66 (-22%); MS model further drops to $51.88 in 2027, assuming users grow from 12M to 28.82M. If user growth misses and ARPU continues to drop → Only cash cow division under pressure. Watch quarterly net user additions and ARPU combo |
⑦ Starship and V3 Deployment Pace | Company claims at least 1,000 V3 deployed within a year; V3 single satellite capability claimed to be >10x V2. 13th flight achieved all goals, but super-heavy booster recovery section only partially reignited engines, hard splashdown. If V3 deployment or reuse delays → Connectivity capacity and Space division revenue both delayed |
⑧ Competition and Regulation | Amazon Leo temporarily lowered spectrum priority by FCC for missing deployment deadline (to 2028/3/30); AST SpaceMobile constrained by New Glenn grounding. SpaceX's application for million-orbital-datacenter satellites faces orbital debris concerns; $60B Cursor acquisition still pending regulatory approval |
⑨ Valuation and Expectations | $114.92 corresponds to approx. 30.3x 2026E EV/Rev, 14.2x 2027E EV/Rev, 19.6x 2028E EPS. Consensus target approx. $230 (+100%), but distribution ranges $115 to $800; MS Bear $75 (-35%). High Expectation + High Dispersion = Extreme sensitivity to any execution flaw |
IX. Conclusion and Operational Framework
SpaceX's first earnings report made one thing clear: its business is materializing as planned, its balance sheet is being overdrawn by this plan. Revenue up 92% YoY, all three divisions accelerating simultaneously, operating losses narrowing from $970 million to $143 million, adjusted EBITDA margin 45.3%, Starlink users doubling and enterprise side +108%, Starship 13th flight captured complete heat shield for the first time—this fundamental side is almost flawless. Yet in the same quarter, capital expenditures were $18.37 billion, 2.35 times revenue, with the company guiding for this pace to continue in the second half. Morgan Stanley upgraded all profit forecasts, yet the target price remained motionless at $300, which is the most precise summary of this earnings report: The money earned extra was eaten by the money spent extra; the anchor of valuation shifted from the income statement to the cash flow statement. What is earned is money priced by the market under the worst-case scenario for the time lag between "capital expenditure becoming compute, and compute becoming revenue"; the risk is that this time lag must be cushioned by its own balance sheet, and the 2027 $104.5 billion cash flow gap alongside unlock supply extending to June 2027 happen to press on the exact same window.
This Article's Viewpoint: Positioning—View SPCX as a combination of "a satellite broadband business already making money (Starlink) + a compute option buying time with its balance sheet (AI) + an unpriced launch cost variable (Starship)," rather than as a company valued by current EPS or EBITDA; Verification Signals—Whether Quarterly AI Revenue ÷ Average Compute (Rev/Watt) holds, net increase in contract sales (non-cancellable metric), combo of Starlink net user additions and ARPU, and whether any equity financing announcements appear; Risk Discipline—Do not use adjusted EBITDA to judge this company (AI division's $1.146 billion positive EBITDA comes 100% from depreciation and stock-based compensation add-backs, operating metric still loses $1.257 billion), nor treat "$100 billion ARR" as revenue (it is annualized run rate, and includes unclosed Cursor deal); Per-share numbers from Q3 onwards are non-comparable with this quarter (weighted shares 5.864B vs ending 13.176B). This is a "bullish on industrial position, but must respect near-term cash flow and unlock supply" combination, for case study purposes only, not representing buy/sell recommendations.
Two Trackable Variables (Determining Stock Price Over Next 6–12 Months): ① Whether unit compute revenue collapses as MS assumes from $31/W to $17/W—one assumption values approx. $42 billion in 2027 revenue, approx. 41% swing; ② How that inevitable 2027 financing occurs, in debt or equity form, and at what price—the window least suitable for equity issuance coincides with the heaviest unlock supply from Q4 2026 to mid-2027.
Binary Paths: Confirmation (Compute exceeds 2 GW by end of 2026 as scheduled, ARR touches $100B + Rev/Watt does not halve as assumed + financing completed at highs in bond form + subsequent unlock batches continue to be smoothly absorbed) → 2027 revenue moves toward upper bound of $144.3 billion, market re-prices based on capacity realization rather than cash flow gaps, repairing towards consensus target price $230乃至 MS $300; Falsification (Rev/Watt collapses faster than assumed + Cloud contracts exercised with 90-day termination rights after end of 2026 + Forced equity financing at unlock lows + Starship/V3 deployment delayed again) → Depreciation ramps faster than revenue, EBIT breakeven timing delayed, valuation returns to pricing described in MS Bear case "Space and Connectivity support 90% of valuation," corresponding to the $75 line.
The copyright of this article belongs to the original author/organization.
The views expressed herein are solely those of the author and do not reflect the stance of the platform. The content is intended for investment reference purposes only and shall not be considered as investment advice. Please contact us if you have any questions or suggestions regarding the content services provided by the platform.
