



Technical Analysis Course Launched: Starting from the First Candlestick
Today, open any trading platform, and you'll find interfaces that vary wildly, with features unique to each. But one thing has never changed: stock prices are recorded using candlestick charts (K-lines). This has almost become the default pricing method for all markets and trading platforms. So where did it come from?
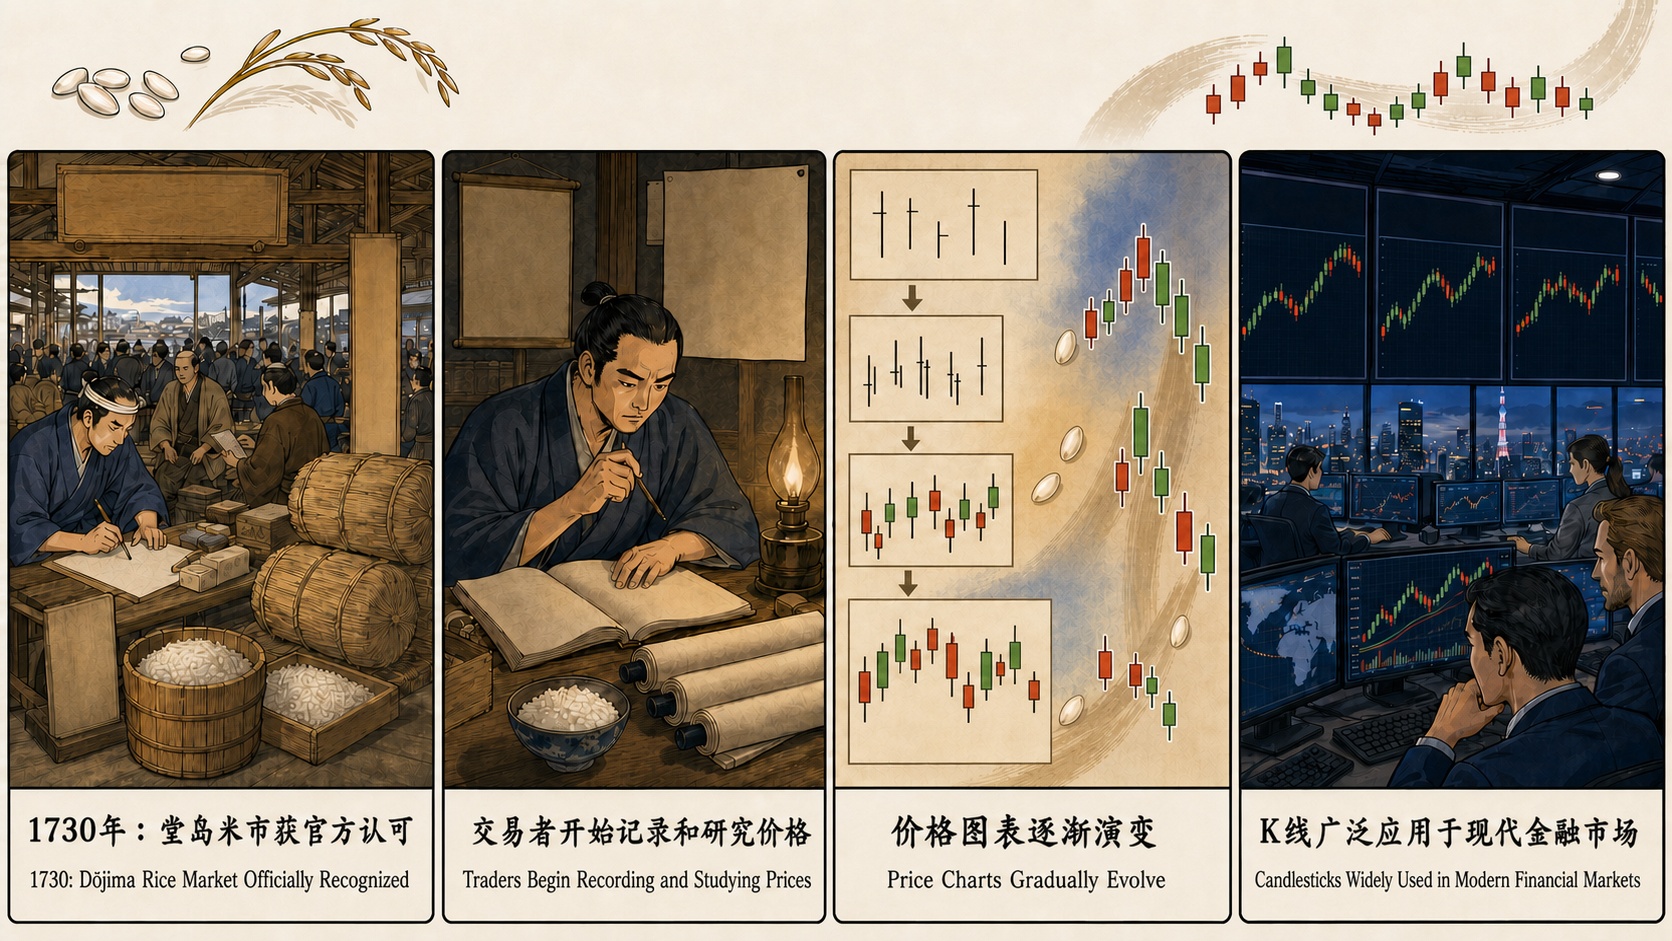
The answer can be traced back nearly three hundred years. In 1730, Dojima in Osaka, Japan, a market dedicated to rice trading, received official recognition. It had members and clearing systems, and is regarded by later generations as one of the world's earliest organized futures markets. Rice prices fluctuated daily. Rice traders wanted to understand why they moved, so they recorded the daily prices—opening price, closing price, highest point reached, and lowest point fallen to. Four numbers, one per day. A rice merchant named Honma Sōkū reportedly accumulated considerable wealth by relying on long-term recording and research of rice prices. Later, people continuously improved this method of "drawing a column representing Open, Close, High, and Low," which slowly evolved into today's candlestick chart.
This method later spread to cotton, stocks, futures, and foreign exchange. The underlying assets changed round after round, but what those looking at the charts truly wanted to understand remained the same thing: behind these lines, what was that group of people thinking, and where would they push the price?
Thus, there have always been people who continue to answer it.
Charles Dow (the "Dow" in the Dow Jones Index) named the chaotic price fluctuations as "trends," and later generations compiled his scattered editorials into a "Dow Theory." The legendary accountant Elliott, sitting idle while ill, actually saw nested waves within the fluctuations and firmly believed they conformed to some natural law. Gann even placed prices and time into geometry and astrology, creating the unique Gann Theory, the authenticity of which remains disputed to this day. And more widely known to the public is Jesse Livermore, who,凭借 a keen market sense, became rich enough to rival nations several times, only to lose everything again, finally ending his own life in a hotel room.
Candlesticks later traveled back to the East. Someone calling themselves "Chan Zhong Shuo Chan" wrote lesson by lesson on their blog. Pen, line segments, central pivot, divergence, level—the structure was as rigorous as a scripture. They entered the market through Zen and carried the Dao through technique. Their identity remains unclear to this day, and they passed away suddenly at the peak of their popularity, leaving behind a sect of self-proclaimed "Chan Friends" who are still deducing the few lessons he left unfinished.
Strangely, in almost every era, academic theories have declared technical analysis useless (the Efficient Market Hypothesis could almost sentence technical analysis to death), yet in almost every era, the smartest and most obsessed geniuses always return again and again to these few lines.
Why? This post does not intend to answer it for you.
We just want to say something simpler: Candlesticks are never crystal balls. They cannot predict tomorrow, nor can they replace your research on a company. It is a craft of "seeing"—seeing how fear and greed wrestle within the same line, seeing how a group's hesitation, decisions, and regrets leave traces on the price.
Precisely because we respect it, we dare not explain it superficially.
Making technical analysis into viral social media hits like "Learn to Catch Limit Ups in Three Days" would actually be easier for us. But that would be disrespectful to this three-hundred-year-old craft, and disrespectful to you. So we chose the slower path: laying it out systematically and sequentially, starting from the most fundamental principles and the first K-line, all the way to volume-price relationships, patterns, and indicators; each lesson aims to be practical on Longbridge, allowing you to look at real market data rather than just memorizing a few cool terms.
And precisely because we respect it, there is one sentence we must put at the very front: Do not blindly trust it.
Those legends used their lives, even their lives, to verify the same thing for us—it has given people insight, but also illusions. Candlesticks give you an extra pair of eyes, but they won't give you a treasure map. Anyone who dares to determine tomorrow's rise or fall based on a single indicator respects neither this craft nor you.
All we can do is hand over this three-hundred-year line to you exactly as it is, honestly and faithfully. As for how to use it after understanding it, and to what extent—that ruler must be held in your own hands.
Starting from the first K-line. What you catch is a gaze that has not broken for three hundred years.
The Technical Analysis course is now live. More course content will be updated continuously. Please stay tuned.
Click the image below for course details 👇

The copyright of this article belongs to the original author/organization.
The views expressed herein are solely those of the author and do not reflect the stance of the platform. The content is intended for investment reference purposes only and shall not be considered as investment advice. Please contact us if you have any questions or suggestions regarding the content services provided by the platform.
