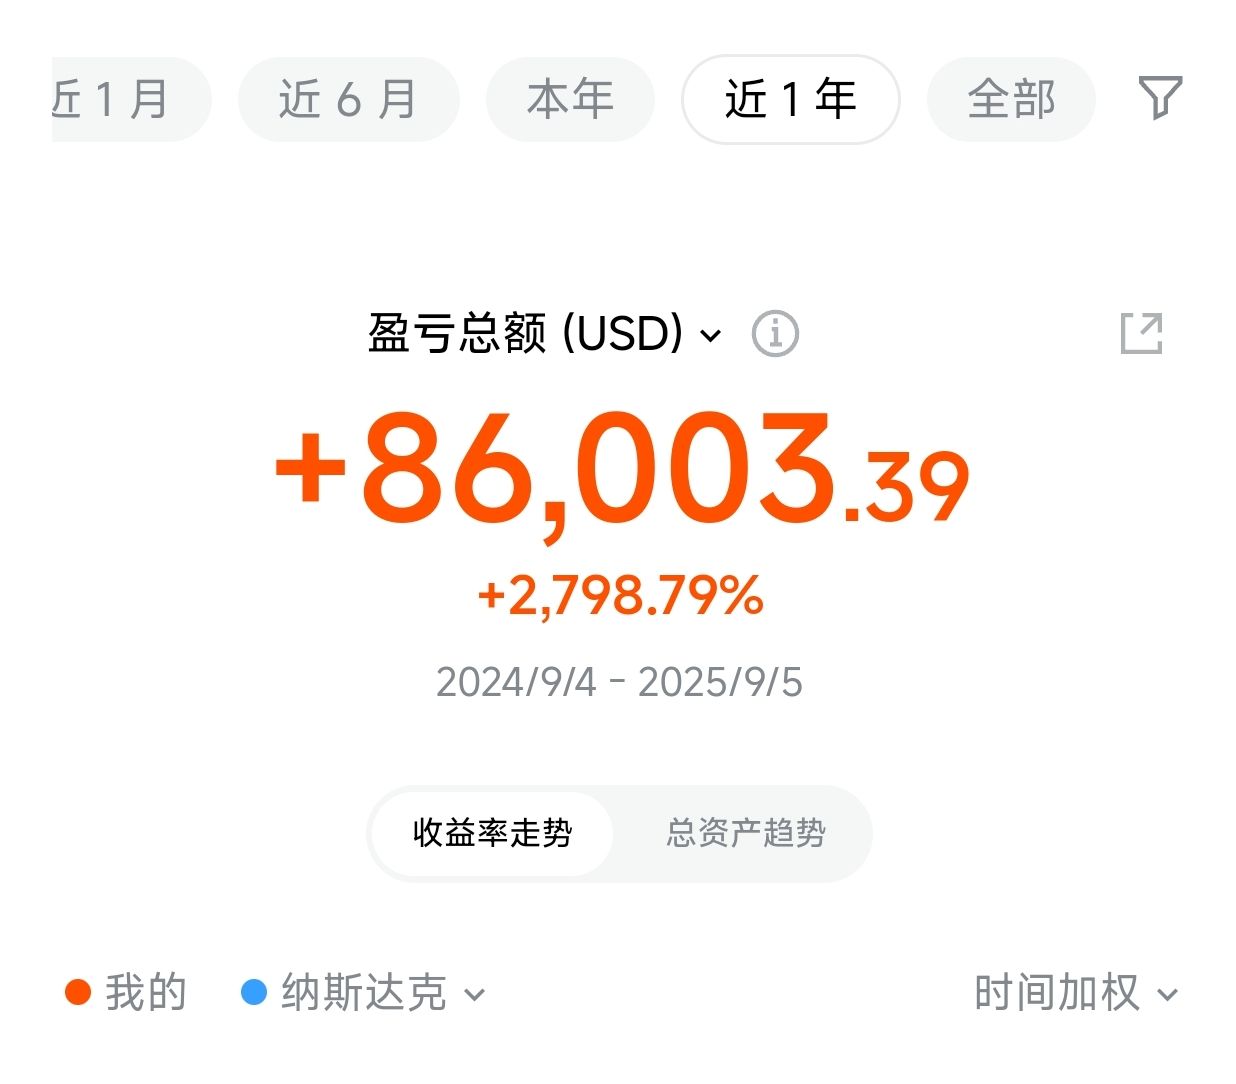
 Rate Of Return
 Total Assets
$NVIDIA(NVDA.US)NVIDIA's volume decline tests key technical levels, short-term adjustment pressure emerges.
NVIDIA (NVDA) showed weak performance today. As of 10:12 AM ET, the stock price was $166.29, down $5.37 (3.13%), with a trading volume of $10.692 billion, ranking second in the market.
Technical indicators show the stock price has fallen below the middle Bollinger Band ($177.744) and is approaching the lower band ($168.047), indicating a weakening short-term trend. The MACD indicator is negative (-3.981), with DIF (-0.519) crossing below DEA (1.472), forming a death cross signal, suggesting increasing downward momentum.
Notably, despite the price drop, a large buy order of 3,000 shares appeared during the session, indicating some buying interest at lower levels. The current TTM P/E ratio is 46.66, suggesting relatively reasonable valuation.
Key support levels are in the $165-$168 range (near the lower Bollinger Band). A decisive break below could lead to further decline toward the $160 psychological level. Resistance levels to watch are $170 (intraday high) and $177 (middle Bollinger Band).
Operation suggestions: Short-term: Cautiously observe, waiting for confirmation of support in the $165-$168 range. Medium-term: If support at $165 breaks, the stock may test the $160-$162 area. Risk control: Consider reducing positions if $165 is decisively broken.
---
This article is for technical analysis only and does not constitute investment advice. The stock market carries risks; invest with caution.
The copyright of this article belongs to the original author/organization.
The views expressed herein are solely those of the author and do not reflect the stance of the platform. The content is intended for investment reference purposes only and shall not be considered as investment advice. Please contact us if you have any questions or suggestions regarding the content services provided by the platform.


