


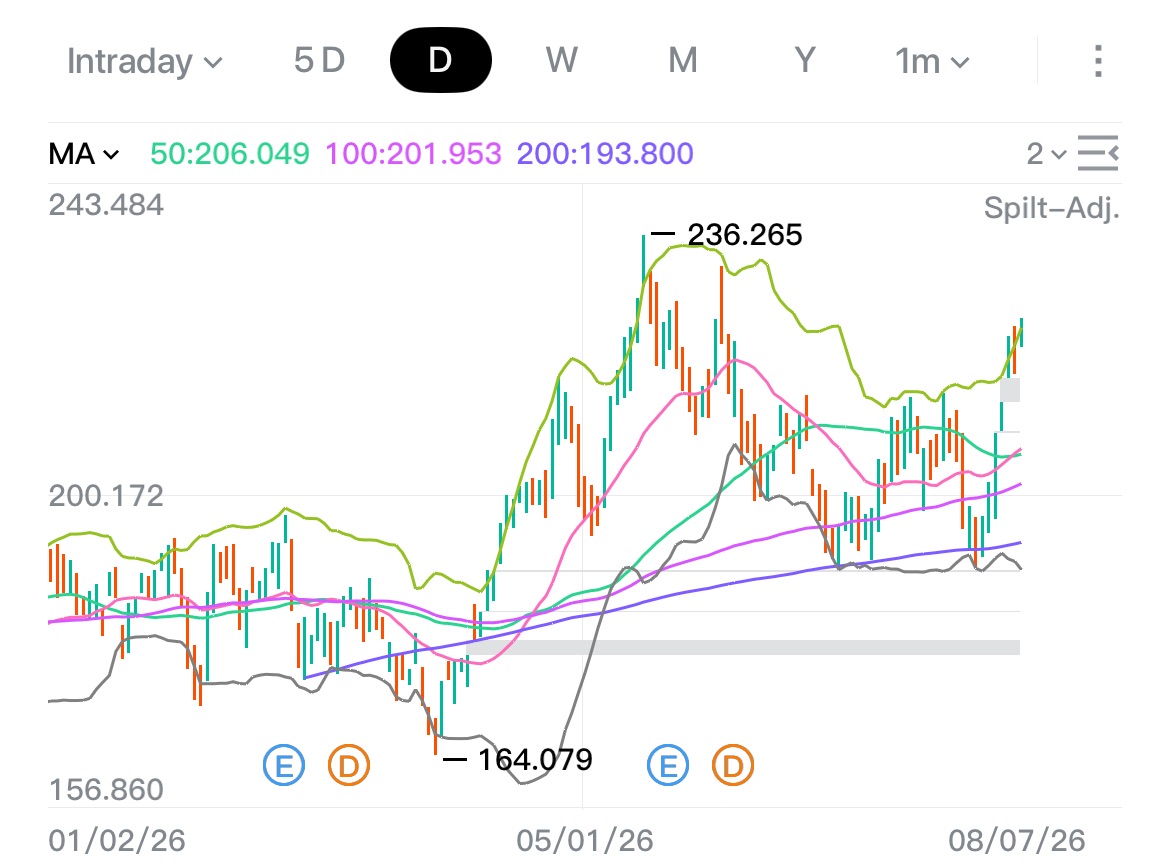
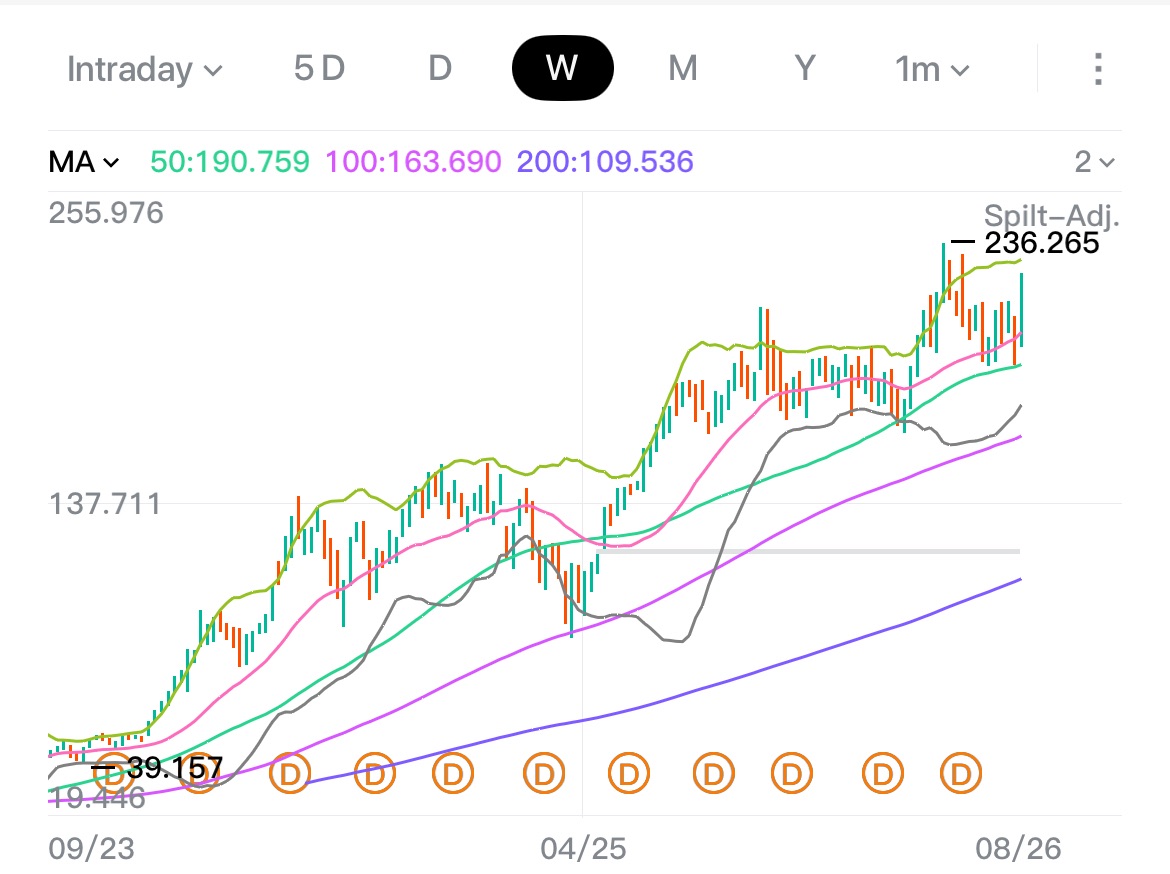
$NVIDIA(NVDA.US)The daily and weekly charts are showing a double bottom pattern. The weekly MA50 190.759 seems to be a good support. I think it should be moving up to test 236 soon but it also depends on how Fed will adjust the interest rate. The weak July job report suggests interest rate cuts may be more likely when before this, many people were expecting a rate hike! The market is that dynamic so it is best to control the position size and stick with stocks that one don’t mind holding for long.

The copyright of this article belongs to the original author/organization.
The views expressed herein are solely those of the author and do not reflect the stance of the platform. The content is intended for investment reference purposes only and shall not be considered as investment advice. Please contact us if you have any questions or suggestions regarding the content services provided by the platform.
