


$NVIDIA(NVDA.US)
On July 29, $NVIDIA(NVDA.US) closed at $190.01 and Williams %R (14) printed −100.00. -100.00!!!!!!!!!!!!That is not merely “oversold” — under the Williams %R calculation, −100 means price closed at the very bottom of its 14-period range.$NVIDIA(NVDA.US): −100 → Momentum ReversalJuly 29Close: $190.01Williams %R: −100Extreme downside momentum / capitulationPrice testing the lower Bollinger BandNowNVDA: approximately $222Price has reclaimed the 8 EMA, 21 EMA, 50 MA and 100 MAUpper Bollinger Band has been brokenWilliams %R has ripped from −100 toward the opposite extremePrevious momentum dashboard showed −9.31MACD has turned bullishRSI moved to 61.6Money flow remains positiveThat is a full momentum regime reversal.The important lessonWilliams %R at −100 wasn't the buy signal by itself.The signal became powerful because it occurred alongside:Washout → support → moving-average reclaim → momentum reversal → breakout.And look at what happened afterward:$190 → $222+ in roughly a week.That's about a 17% underlying move.What I see nowWilliams %R moving from −100 to near −10 shouldn't automatically be interpreted as:“Overbought = SELL.”In a strong momentum reversal, an overbought Williams %R can instead indicate that buyers have seized control of the tape.The next confirmation is whether NVDA can stay pinned in the upper portion of its 14-day range while holding roughly $218–$212.That July 29 −100 print may end up being one of the cleanest momentum-reset signals of this entire $NVIDIA(NVDA.US) move.CAPITULATION: −100 → RECLAIM → BREAKOUT → MOMENTUM EXPANSION.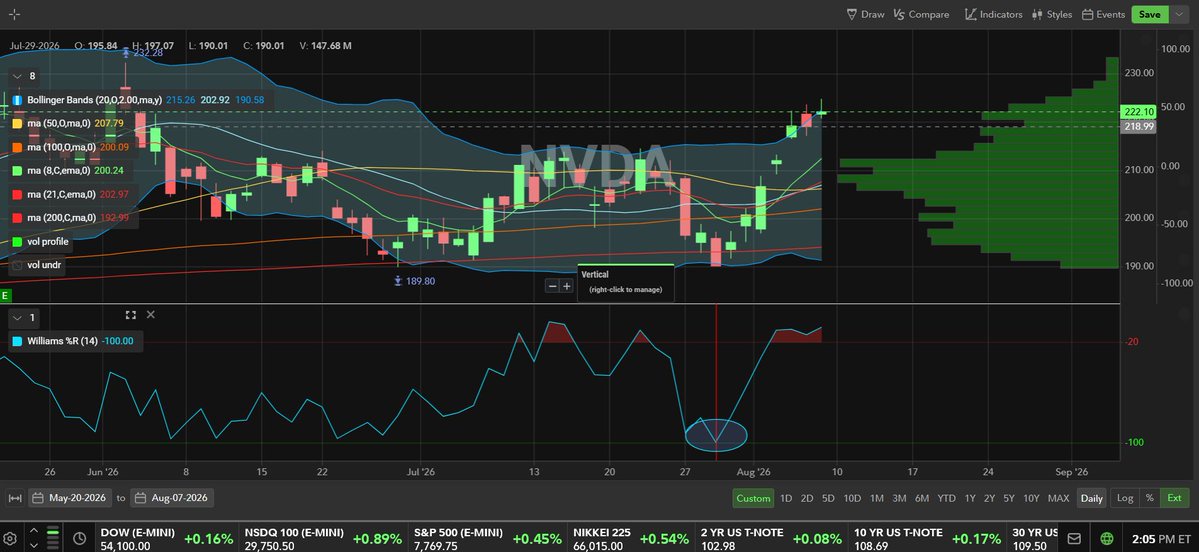
The copyright of this article belongs to the original author/organization.
The views expressed herein are solely those of the author and do not reflect the stance of the platform. The content is intended for investment reference purposes only and shall not be considered as investment advice. Please contact us if you have any questions or suggestions regarding the content services provided by the platform.
Post your comment

No Comments