
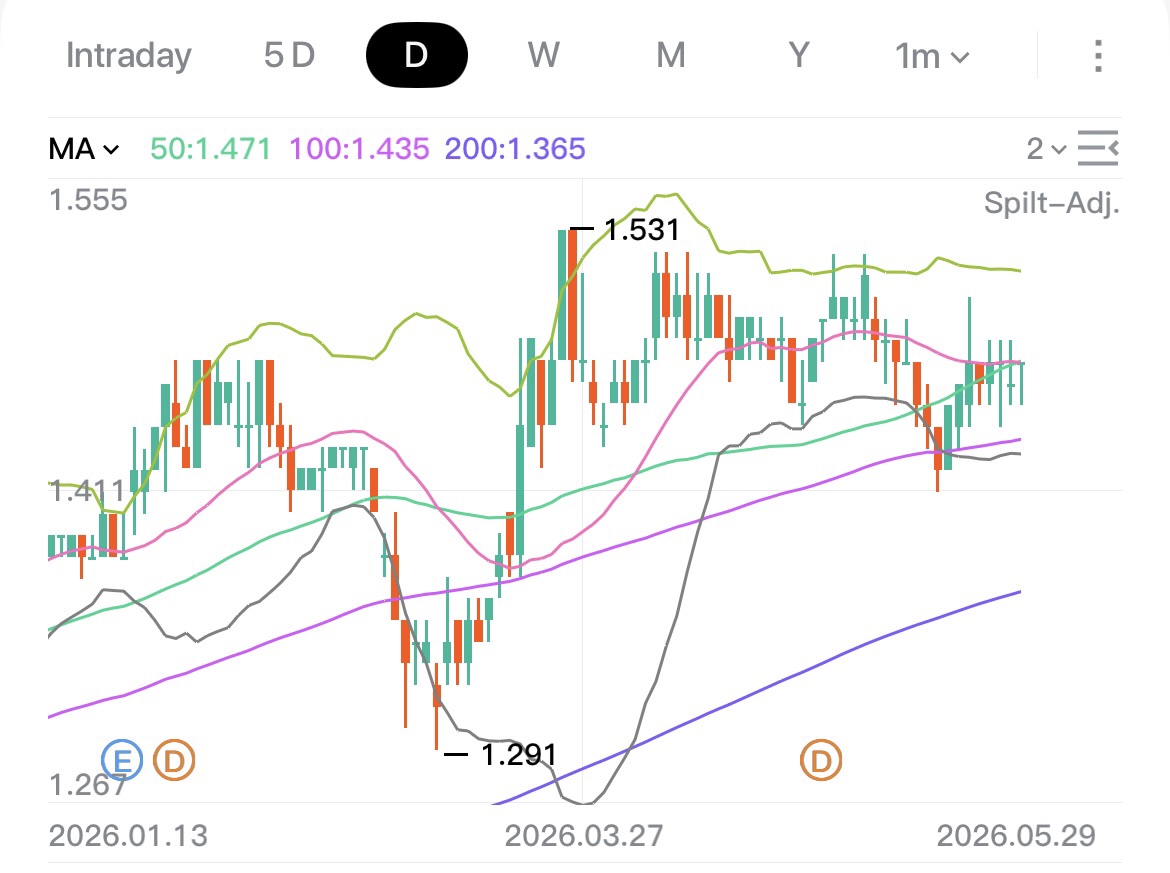
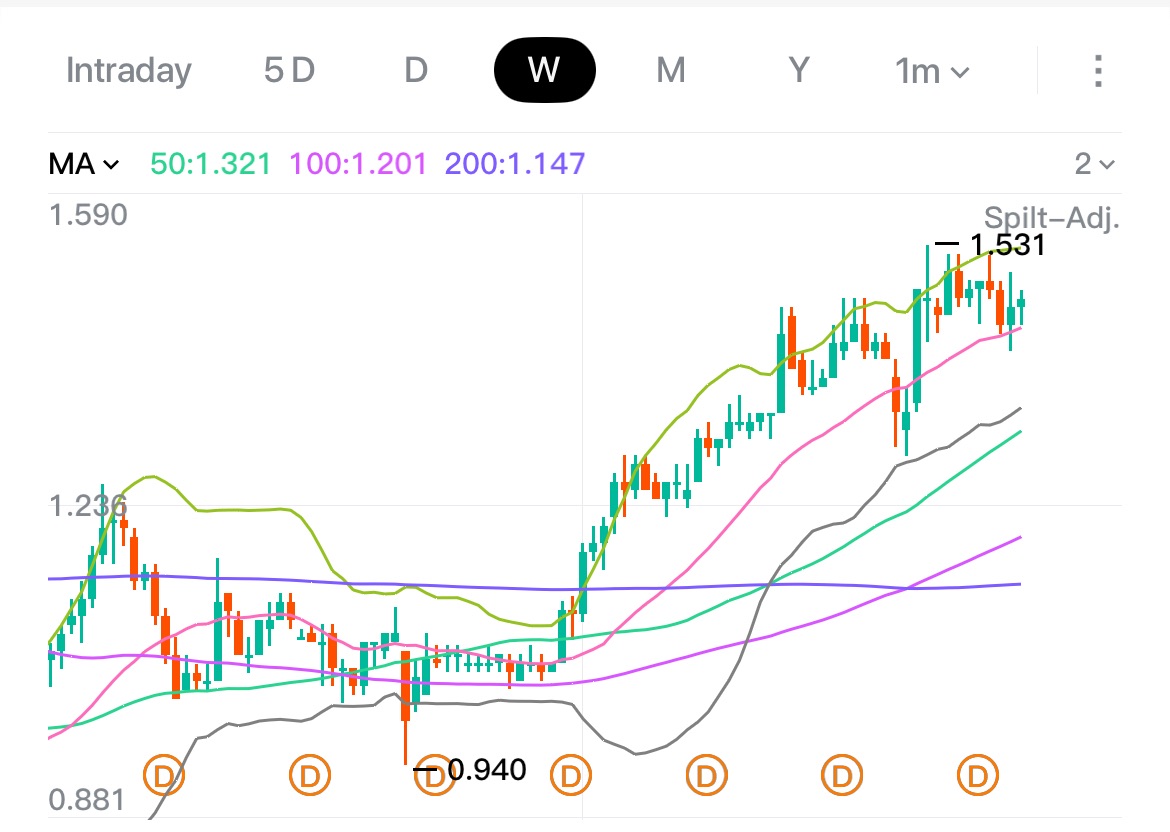
$Suntec Reit(T82U.SG)For the mid term, the uptrend is still intact. The price is hovering around MA50 for the daily chart but still above MA50 for the weekly chart. When it crossed below the lower limit of the Bollinger Band in the past, it had bounced and retraced to the upper band eventually so that may be a good entry point if it ever hits that again. Please use this indicator in combination with other indicators for confirmation of a reversal as no indicator is perfect.
The copyright of this article belongs to the original author/organization.
The views expressed herein are solely those of the author and do not reflect the stance of the platform. The content is intended for investment reference purposes only and shall not be considered as investment advice. Please contact us if you have any questions or suggestions regarding the content services provided by the platform.
