
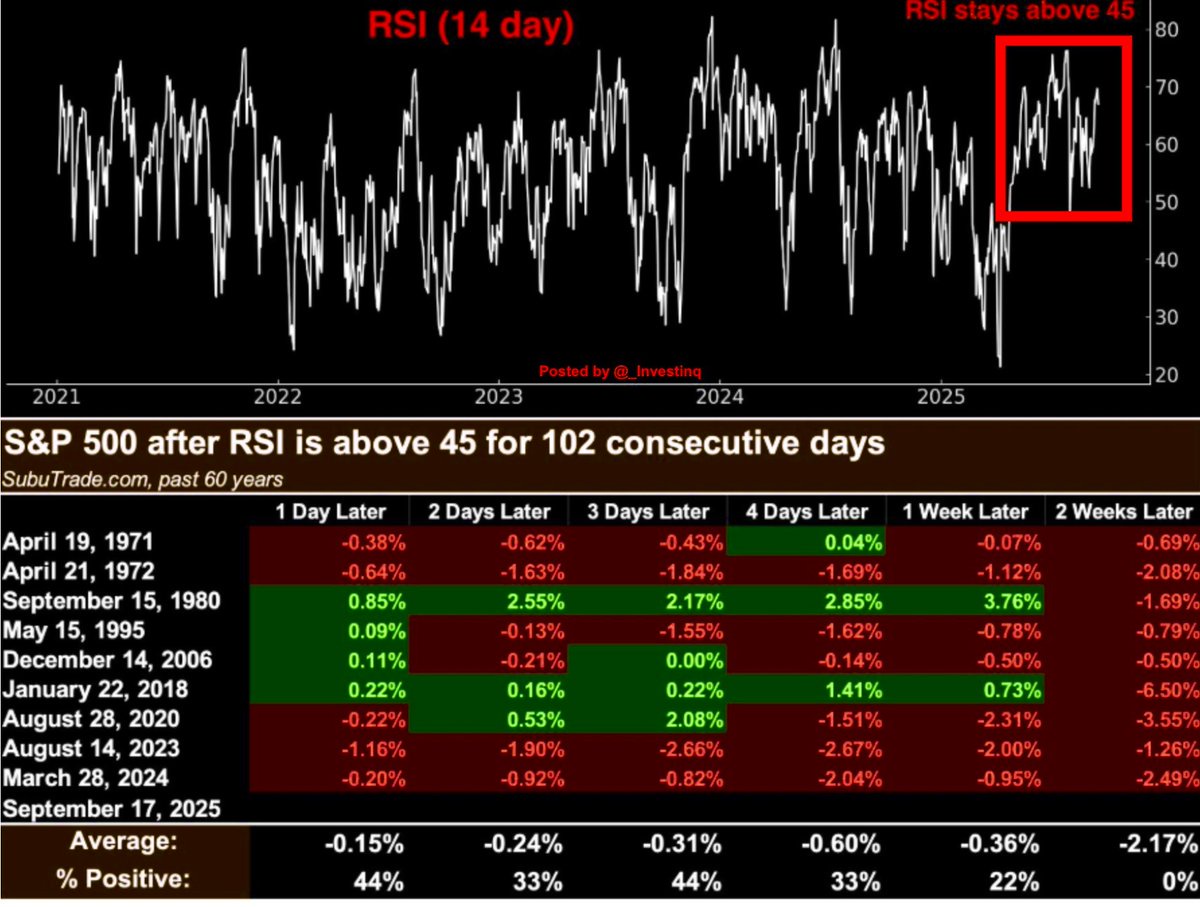
The Relative Strength Index is one of those indicators traders constantly keep an eye on because it shows when momentum is strong, when it’s fading and when things might be stretched. It moves on a scale between zero and one hundred. Readings above seventy are usually called overbought, which means prices may have run too far too fast. Readings under thirty are called oversold, suggesting the opposite prices have fallen hard and might bounce. Sitting around fifty is neutral a balance between buying and selling pressure. What makes the current setup in the S&P 500 stand out is how steady the momentum has been. For one hundred and two straight trading days, the index’s fourteen-day RSI has stayed above forty-five. That’s a rare streak by historical standards and it shows just how persistent the optimism has been
When you look back through six decades of market history, this kind of setup doesn’t happen often, and when it does, the short-term pattern afterward has been surprisingly consistent. Every single time the S&P 500 managed to stay this strong for that long, the following two weeks brought losses. The average decline was just over two percent. More striking, there wasnt a single case where the market actually posted a gain two weeks later. Even the chance of being higher after just one week was low, around one in five. That tells us that these long momentum runs often end not with a continuation but with a pause or a slip. Why does this happen? Markets tend to revert to the mean. Momentum can carry prices higher for a while, but eventually buyers get exhausted. At some point, profit-taking kicks in, enthusiasm cools, and prices pull back toward a more sustainable pace That doesn’t mean the entire bull market is over or that a deep downturn is coming. It simply reflects the natural rhythm of markets after a long stretch of relentless strength, it’s normal for them to give some ground back. Traders watching short-term signals usually use this as a reason to manage risk more tightly, scale back on aggressive bets, or prepare for volatility.For longer-term investors, the story is different. This kind of technical stretch isn’t necessarily a red flag about the economy or a signal to abandon positions. It’s more of a reminder that markets move in cycles. Even in healthy uptrends, pullbacks happen, and they’re often a reset rather than a reversal. The bigger drivers economic growth, earnings, interest rates, and global events still determine where markets head over months and years. So, the fact that the S&P 500 has held its RSI above forty-five for over a hundred days tells us two things at once. It’s a sign of unusual strength and steady confidence but it’s also a warning that short-term history points toward weakness once a streak runs this long. For anyone tracking technicals, this is less about predicting a crash and more about expecting a breather. The long-term direction will still be written by the broader economic backdrop, but for now, the odds suggest the market may finally need to catch its breath.Source: StockMarket.News
The copyright of this article belongs to the original author/organization.
The views expressed herein are solely those of the author and do not reflect the stance of the platform. The content is intended for investment reference purposes only and shall not be considered as investment advice. Please contact us if you have any questions or suggestions regarding the content services provided by the platform.
