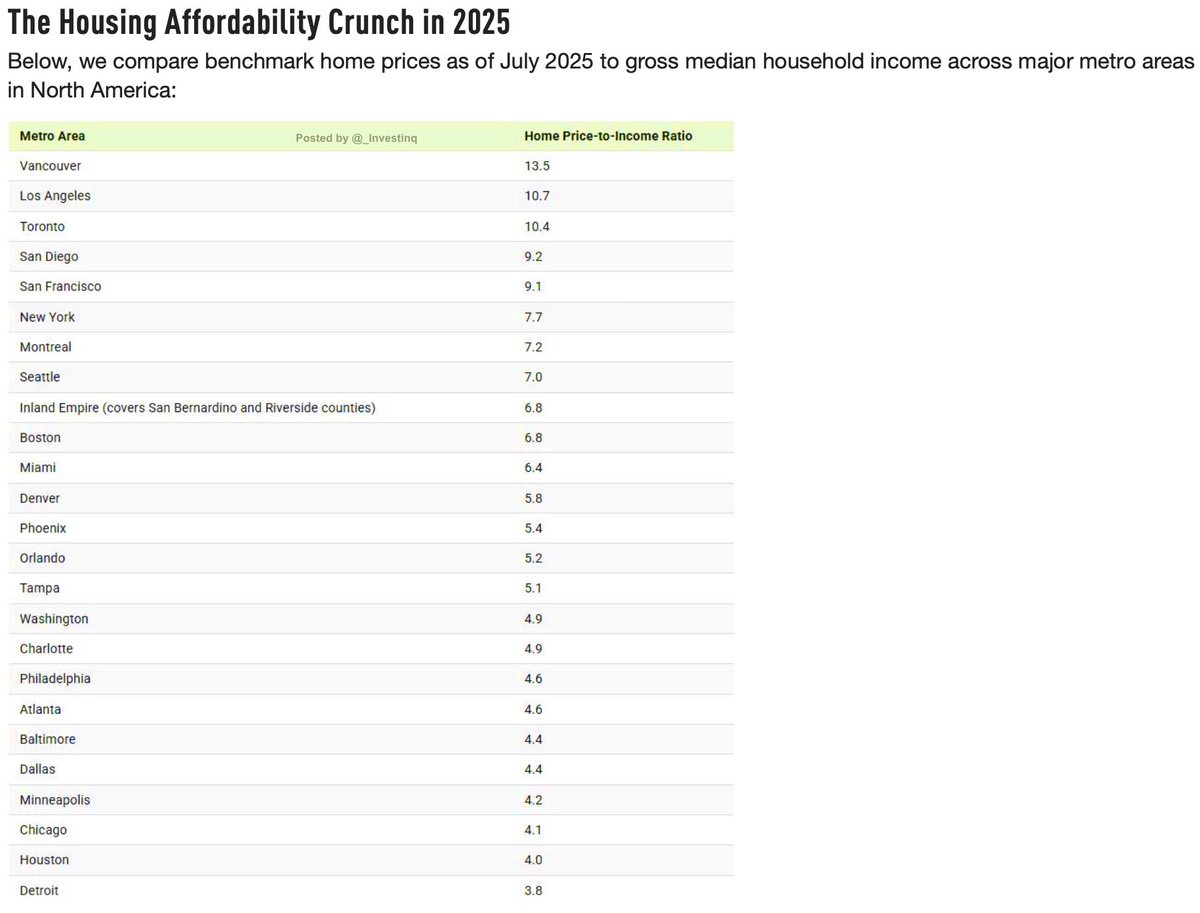
The Chart Every Homebuyer Needs to See Right Now:
Housing affordability continues to collapse in 2025, with Vancouver at a staggering 13.5x price-to-income ratio. Toronto follows close behind, while West Coast metros like Los Angeles, San Diego, and San Francisco range between 8–10x, all sitting at levels worse than the 2008 housing bubble. Other major U.S. markets have also seen affordability deteriorate, showing the crunch is hitting nearly everywhere.Source: StockMarket.News
The copyright of this article belongs to the original author/organization.
The views expressed herein are solely those of the author and do not reflect the stance of the platform. The content is intended for investment reference purposes only and shall not be considered as investment advice. Please contact us if you have any questions or suggestions regarding the content services provided by the platform.

