


US Stock Market's "Shock Absorber" Vanishes: Will the AI Trade Correction Spread to the Broader Market After Options Expiry?
Following July's options expiration, the "positive gamma" buffer in the US stock market has significantly weakened, potentially amplifying market volatility. Institutions warn that the AI trade correction, previously confined to the semiconductor sector, may spread to the broader market. Earnings reports from tech giants such as Alphabet and Tesla this week will serve as key catalysts determining market direction
As the July options expiration (OPEX) concludes, the positive gamma protection layer that helped stabilize the US stock market has largely dissipated. This means that the AI-related trade correction, previously confined to the semiconductor sector, now faces the risk of spreading to the broader market.
Last week, a series of supportive factors bolstered the market, including inflation data coming in below expectations, strong banking earnings, retail sales exceeding forecasts, and positive comments from ASML and TSMC regarding semiconductor demand. However, news of the release of the Chinese AI model Kimi-3 on Friday triggered a broad decline in global chip stocks, putting pressure on the S&P 500 on the day. Analysis firm SpotGamma pointed out that the market remained generally stable last week—including the rebound in early trading on Friday—largely relying on the support of the positive gamma mechanism, where option market makers dampened price volatility through contrarian trading.
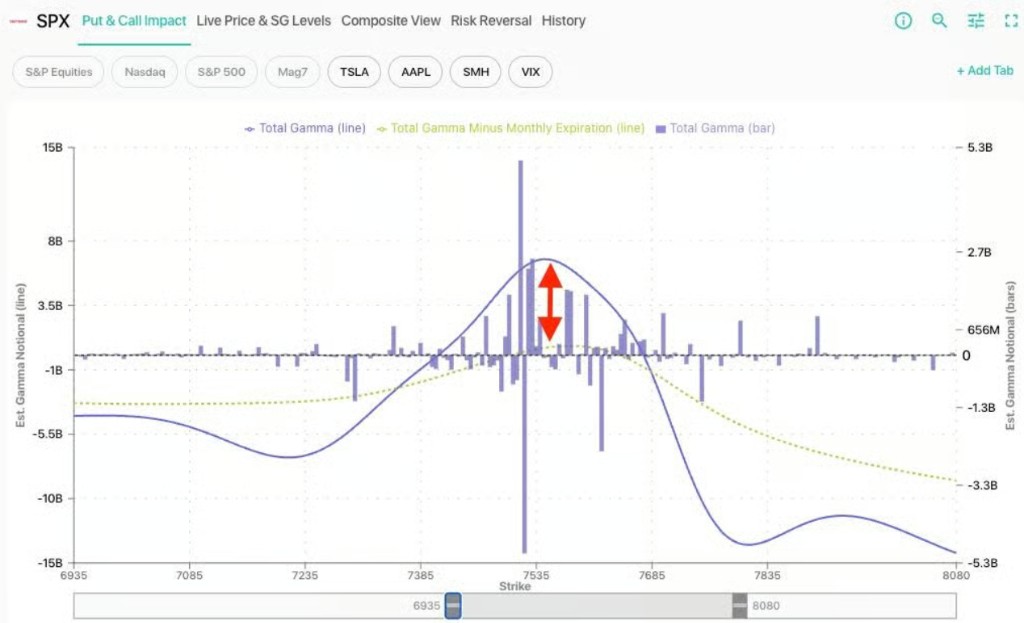
With the end of July OPEX, this "shock absorber" has essentially become ineffective. In this context, this week's earnings season will become the core driver of the market. The performance of tech giants such as Alphabet and Tesla (TSLA) will be tested by the market in a more volatile environment.
Positive Gamma Fades, Market Cushion Withdraws
According to SpotGamma's Synthetic Open Interest Model, market makers' gamma exposure shifted significantly lower after July OPEX. In the gamma exposure chart released by the firm, the purple line represents the total gamma level before Friday's expiration, while the yellow line shows the gamma level after options expiration. The gap between the two clearly illustrates the substantial reduction in the market's protective layer.
In a positive gamma environment, option market makers tend to operate contrarily—buying when the market falls and selling when it rises—thereby creating a natural mean-reversion force that suppresses large price swings. Once this mechanism weakens, the market becomes more sensitive to directional capital flows, and the magnitude of price fluctuations may amplify accordingly.
SpotGamma points out that the post-OPEX landscape points to a core question: Will the reduction in positive gamma allow the decline, previously confined to the semiconductor sector, to eventually spread to the broader market?
Semiconductors Under Pressure, Capital Rotation Sustains Broad Market Resilience
Over the past month, internal capital rotation in the market has quietly unfolded.
Traders have continued to withdraw from the semiconductor sector, shifting their positions to the "Magnificent Seven" (Mag 7), software, and healthcare sectors. This trend has dragged the Semiconductor ETF (SMH) to a low approximately 20% below its historical highs.
However, the boost from capital inflows into other sectors has allowed the S&P 500 to demonstrate considerable resilience overall. It is precisely this internal divergence—some sectors falling while others rise—that, combined with positive gamma, has enabled the broader market to remain stable.
SpotGamma has previously conducted an in-depth analysis of the widening volatility divergence between the S&P 500 and the Nasdaq.
From the perspectives of both realized volatility and implied volatility, the S&P 500 currently has a stronger capacity to absorb differentiation among its constituent stocks. However, the firm also warns that current dispersion indicators are at extreme levels, meaning that upcoming catalysts could trigger an abnormal spike in volatility.
Earnings Season Takes the Baton, Key Levels Become Decisive Factors
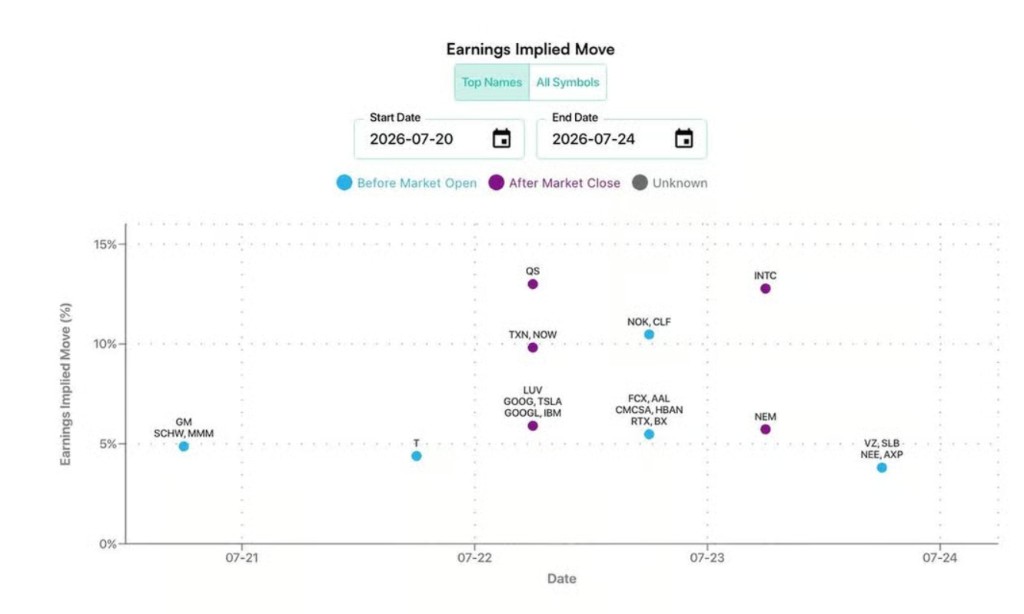
The macroeconomic calendar is relatively light in the coming week, with market focus shifting entirely to earnings season. SpotGamma uses at-the-money straddles for the first expiration date to measure implied earnings volatility, thereby estimating the market's expected reaction to earnings events.
This Wednesday, Alphabet and Tesla from the Mag 7 will release their earnings reports one after another, with both showing an implied volatility move of approximately 6%. Additionally, several semiconductor and software companies will announce their results this week, including Texas Instruments (implied volatility 9%), Intel (implied volatility 13%), and ServiceNow (implied volatility 11%).
SpotGamma points out that the single-stock implied volatility for leading market stocks remains high. Given the significant roll-off of index-level positive gamma after OPEX, the potential for earnings reactions to transmit to the broader market has risen significantly.
Regarding key technical levels for the S&P 500, resistance levels are at 7,500, 7,520, and 7,600 points; 7,480 points is the bull-bear dividing line (bearish below this level, bullish above); support levels are at 7,480 and 7,400 points.
