
CICC Commentary on November Trade Data: The gap between domestic and external demand widens, and imports weaken after excluding the base effect

CICC analyzed the trade data for November 2025, pointing out that the disparity between domestic and external demand has widened, with exports exceeding expectations and imports falling short of expectations. Exports to the U.S. have declined, while exports to non-U.S. regions have shown steady growth. Mechanical and electrical products are the main driving force. It is expected that exports in December may decline year-on-year
In November 2025, exports in US dollar terms increased by 5.9% year-on-year (compared to -1.1% in October), while imports rose by 1.9% year-on-year (compared to +1.0% in October). Exports exceeded expectations, and imports fell short of expectations (Bloomberg's market expectations for exports and imports were +4.0% and +2.8%, respectively). The decline in the base number and stable demand drove the year-on-year increase in exports compared to October. Export data by region continued to show a decline in exports to the United States, while maintaining robust growth in exports to non-US regions. In terms of products, electromechanical products were the main driving force. After excluding the base effect, imports weakened. We expect that as the base number rises marginally, year-on-year exports in December may decline.
The decline in the base number and stable demand drove the year-on-year increase in exports compared to October. The main reason for the fluctuations in year-on-year export growth from September to November 2025 is the fluctuations in the base number from the same period in 2024, where year-on-year exports from September to November 2024 were 2.3%, 12.6%, and 6.6%, respectively. If we calculate the two-year compound year-on-year growth rate to exclude the impact of the 2024 base number, the two-year compound year-on-year growth rates for September to November 2025 are 5.3%, 5.5%, and 6.2%, maintaining robust growth. From the perspective of demand on a month-on-month basis, the manufacturing PMI for developed markets in November 2025 was 50.5%, a decrease of 0.1 percentage points month-on-month, remaining stable.
Export data by region continued to show a decline in exports to the United States, while maintaining robust growth in exports to non-US regions. Although the United States canceled the so-called "fentanyl tariff" of 10% on Chinese goods starting November 10, exports from China to the United States in November fell by 28.6% year-on-year, further widening the decline from -25.2% in October. We believe this may be partly due to the fading effect of previous "export rushes," and on the other hand, there may be a certain lag from the reduction in tariffs to the marginal increase in exports to the United States. In November, year-on-year exports to the European Union, ASEAN, Latin America, and Africa were 14.8%, 8.2%, 14.9%, and 27.6%, respectively (compared to 0.9%, 11.0%, 2.1%, and 10.5% in October), all maintaining robust growth.
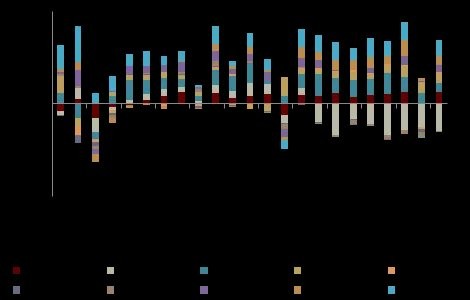
In terms of products, electromechanical products were the main driving force. In November, exports of electromechanical products increased by 9.7% year-on-year (compared to 1.2% in October), contributing 5.8 percentage points to overall year-on-year export growth (compared to 0.8 percentage points in October), while exports of labor-intensive products decreased by 8.3% year-on-year (compared to -14.8% in October), contributing -1.3 percentage points to overall year-on-year export growth (compared to -2.4 percentage points in October). In terms of specific products, exports of automobiles and parts, ships, integrated circuits, and other products maintained high growth rates. From the perspective of the volume and price decomposition of major product exports, the export price of integrated circuits in November increased by 28% year-on-year, further rising from 17% in October, reflecting the increased supply-demand gap for electronic products such as memory driven by AI trends. However, the year-on-year growth rate of export prices for other major products remained weak. We believe that this structural difference is the main reason for the significant year-on-year increase in export value/export freight volume in November compared to October, with the year-on-year export value/export freight volume in November being 17.3% (compared to -1.5% in October) Excluding the base effect, imports weakened. Imports were also affected by the base effect from the same period last year. Excluding this effect, the two-year compound year-on-year growth rate of imports in November was -1.1%, further widening from October's -0.7%. From the perspective of volume and price decomposition, import prices in November are likely to marginally improve, with the November CRB index year-on-year at 6.1% (compared to 4.9% in October). The year-on-year change in import value/import freight volume in November was -1.0% (compared to -2.3% in October), indicating that the year-on-year growth rate of import quantity may be weaker than the nominal value, still awaiting further strengthening of domestic demand policies. In terms of year-on-year changes in the quantity of major imported goods, the year-on-year decline in November for automobiles, coal, copper materials, and plastics was significant.
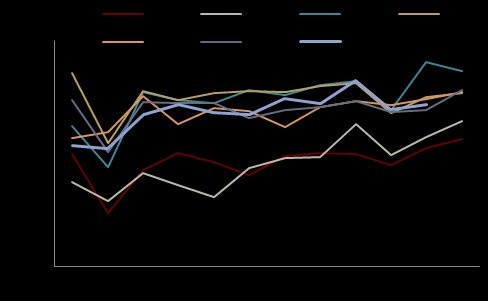
Chart 1: Monthly Export Value

Source: Wind, CICC Research Department
Chart 2: Monthly Import Value
Source: Wind, CICC Research Department
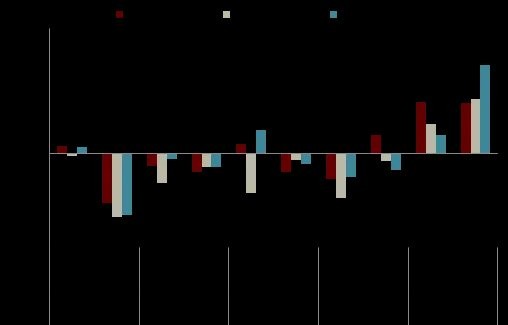
Chart 3: Contribution to Year-on-Year Export Growth Rate by Region
Source: Wind, CICC Research Department
Chart 4: Contribution to Year-on-Year Export Growth Rate by Major Commodity Category
Source: Wind, CICC Research Department
Chart 5: Year-on-Year Growth Rate of Import and Export Value/Freight Volume
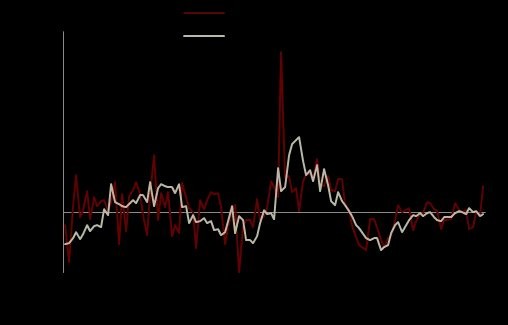
Source: Wind, CICC Research Department
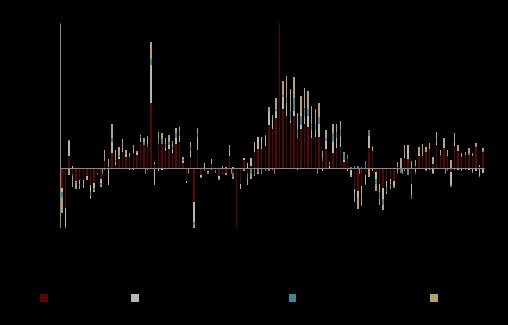
Chart 6: Year-on-Year Changes in Quantity and Price of Major Exported Goods
Source: Wind, CICC Research Department
Chart 7: Year-on-Year Growth Rate of Exports and Imports to Major Regions (Unit: %)
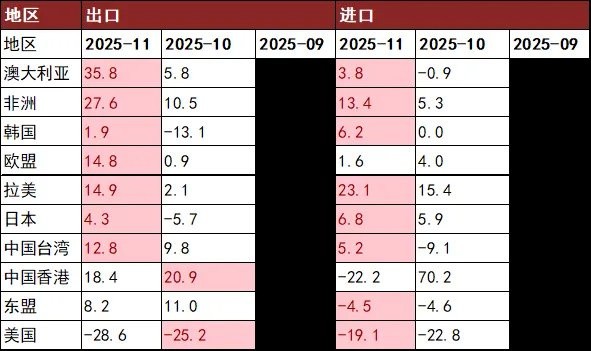 Source: CEIC, CICC Research Department
Chart 8: Year-on-Year Growth Rate of Major Commodity Export Amounts (Unit: %)
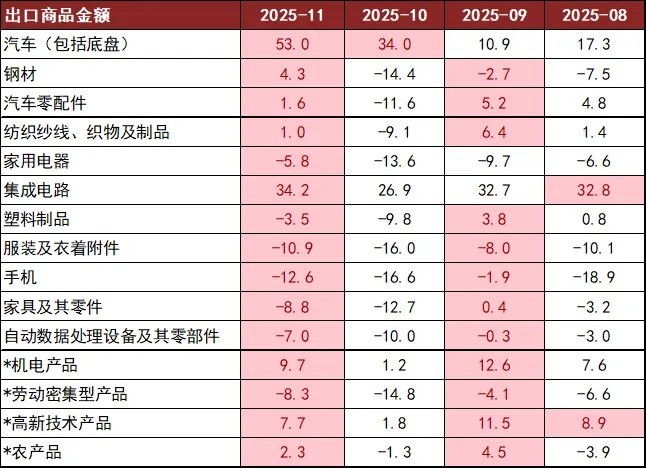
Note: * Represents major categories of commodities, or includes related commodities already listed in this table.
Source: CEIC, CICC Research Department
Chart 9: Year-on-Year Growth Rate of Major Commodity Imports (Unit: %)
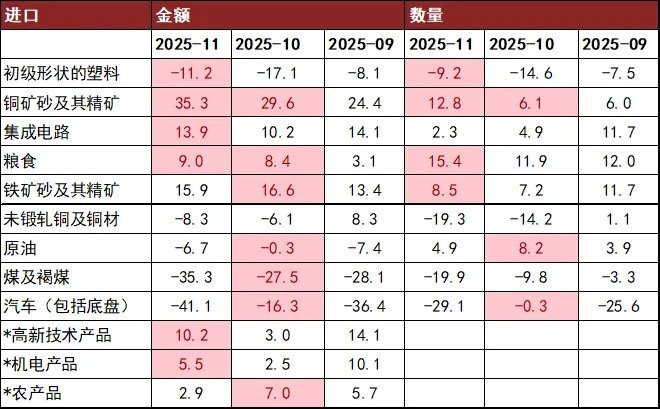
Note: * Represents major categories of commodities, or includes related commodities already listed in this table.
Source: CEIC, CICC Research Department
Risk Warning and Disclaimer
The market has risks, and investment requires caution. This article does not constitute personal investment advice and does not take into account the specific investment objectives, financial conditions, or needs of individual users. Users should consider whether any opinions, views, or conclusions in this article are suitable for their specific circumstances. Investment based on this is at one's own risk
