
Bank of America Merrill Lynch: Key indicators show that U.S. stocks are far from extreme "bubble" levels

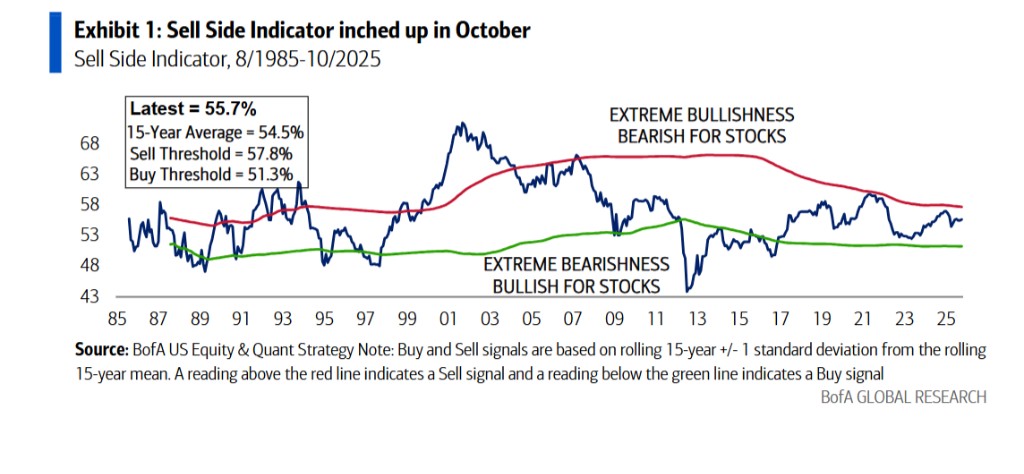
美銀的 “賣方指標” 10 月微升至 55.7%,仍處於 “中性” 區間,距離觸發 “賣出” 信號的 57.8% 尚有距離。並且,歷史上市場見頂時,該指標的讀數通常會超過 59%。根據該指標的歷史模型,當前 55.7% 的水平預示着標普 500 指數在未來 12 個月內有 13% 的潛在價格回報。
隨着標普 500 指數錄得自 2021 年以來最長的連續六個月上漲,市場關於 “非理性繁榮” 的討論再起。
然而,據追風交易台消息,美銀美林 11 月 2 日發佈的最新報告指出,一項關鍵的華爾街情緒指標——"賣方指標"(Sell Side Indicator, SSI)——目前遠未達到觸發 “賣出” 信號的極端 “泡沫” 水平。
“賣方指標” 是一個逆向情緒信號,即當華爾街策略師整體極度悲觀時,它往往預示股市上漲,反之亦然。數據顯示,該指標在 10 月從 55.5% 微升至 55.7%。
報告指出,當前 55.7% 的讀數仍處於 “中性” 區域。雖然它比觸發 “買入” 信號的閾值(51.3%)要遠,但距離觸發 “賣出” 信號的閾值(57.8%)仍有 2.1 個百分點的差距。
更重要的是,美國銀行強調,歷史上市場見頂時,該指標的讀數通常會超過 59%。這意味着,儘管看空者越來越少,但市場情緒尚未達到非理性的狂熱程度。
“賣方指標” 暗示未來一年仍有 13% 上漲空間
“賣方指標” 不僅是一個情緒温度計,更是一個具備預測能力的工具。美國銀行的分析顯示,該指標在預測標普 500 未來 12 個月回報方面的能力(R²值為 25%),顯著優於市盈率、股息率等其他單一因子模型。
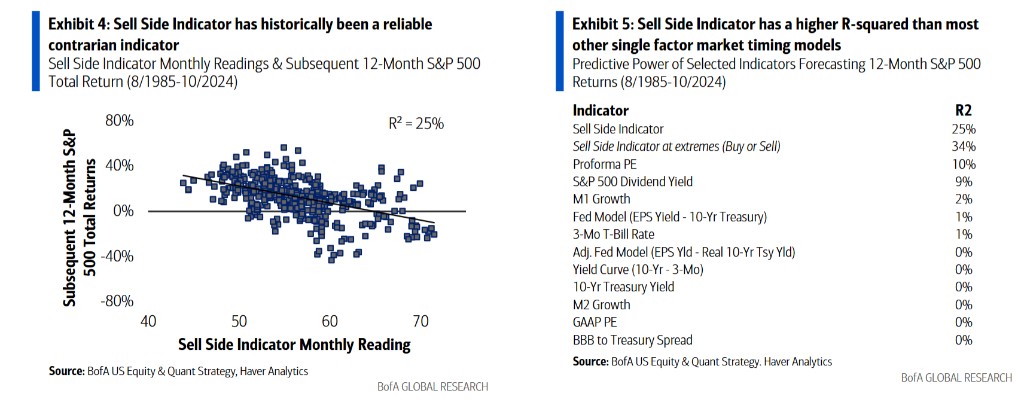
基於其歷史數據模型,報告明確指出,當前 55.7% 的 SSI 水平意味着標普 500 指數在未來 12 個月內有 13% 的健康價格回報。不過,此預測僅是美銀設定標普 500 目標價的五個影響因素之一。
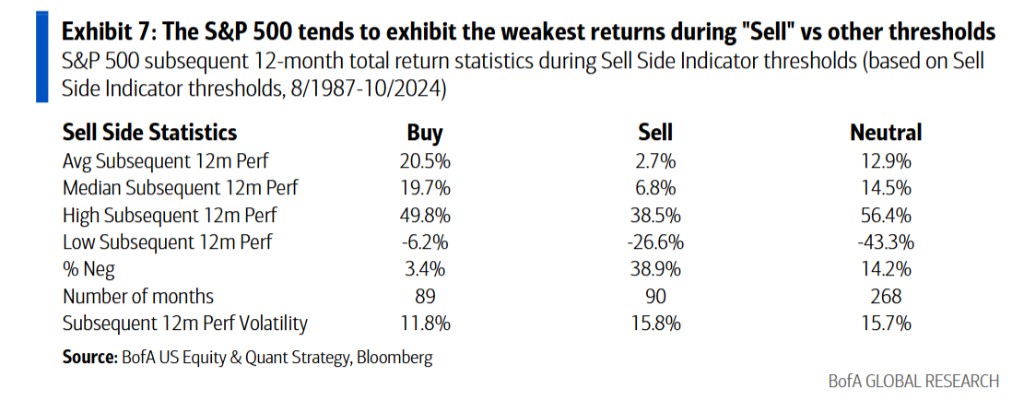
回顧歷史表現,該指標的反向預示能力十分清晰:
- 當指標處於 “買入” 區間時,標普 500 在隨後的 12 個月平均總回報率為 20.5%。
- 當指標處於 “賣出” 區間時,隨後的 12 個月平均總回報率驟降至 2.7%。
目前 “中性” 的讀數,暗示市場既非極端低估,也非極端高估。
基本面強勁,但市場已提前定價
報告同時分析了市場的基本面。在已公佈財報的公司中,有 63% 的公司實現了每股收益(EPS)和營業收入雙雙超預期,這是自 2021 年以來的最高比例,顯示出企業基本面的強勁。
然而,市場對此的反應卻揭示了另一面。報告數據顯示,雙雙超預期的公司,其後一天的股價平均僅跑贏市場 0.9 個百分點,低於 1.4 個百分點的歷史均值。與此同時,業績未達預期的公司則遭到嚴厲懲罰,股價平均跑輸市場 7.2 個百分點,幾乎是通常跌幅的三倍。
這一現象有力地表明,在財報季開始前,大量的 “好消息” 已經被市場消化和定價。投資者對未來的預期很高,這使得任何令人失望的消息都可能引發劇烈拋售。
報告最後提醒,儘管流動性依然充裕,但投資者需警惕任何流動性渠道的逆轉,尤其是當美聯儲降息週期與信貸緊縮同時發生時,這對股市而言通常是最糟糕的階段。
~~~~~~~~~~~~~~~~~~~~~~~~
以上精彩內容來自追風交易台。
更詳細的解讀,包括實時解讀、一線研究等內容,請加入【追風交易台▪年度會員】
