
GF Securities' Guo Lei: September CPI continues to show slow improvement characteristics, and "anti-involution" remains very important for PPI recovery

廣發證券的郭磊分析了 9 月的 CPI 和 PPI 數據,CPI 同比下降 0.3%,略低於預測,而 PPI 同比下降 2.3%。CPI 環比增長 0.1%,消費品價格上漲 0.3%。核心 CPI 同比增長 1.0%,為連續第五個月改善。豬肉和酒類價格繼續下跌,而醫療服務價格保持增長。儘管 PPI 環比未轉正,但已連續兩個月保持零增長。
摘要
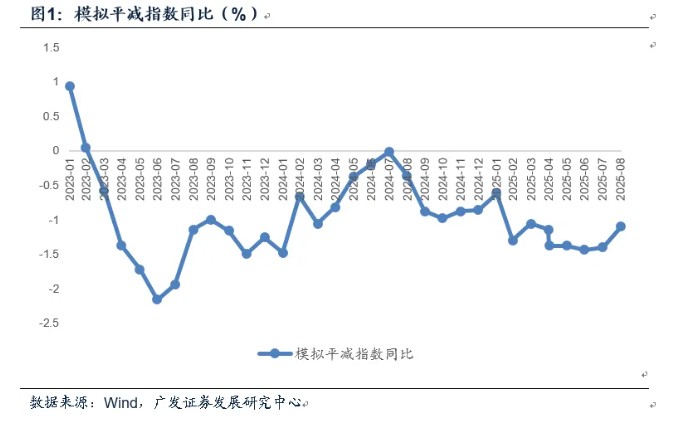
第一,9 月 CPI 同比-0.3%,略低於我們模型預測的-0.18%,高於前值的-0.4%;PPI 同比-2.3%,和我們預測的-2.36% 基本吻合,高於前值的-2.9%。按照 CPI 和 PPI 分別 60%、40% 模擬的平減指數約為-1.10%,高於前值的-1.40%,屬於 4 月以來最高。
第二,CPI 延續緩慢改善的特徵:(1)環比為 0.1%,略高於前值的零增長;(2)消費品價格環比上漲 0.3%,高於前值的 0.1%。[1] 扣除能源的工業消費品價格上漲 0.5%,影響 CPI 環比上漲約 0.12 個百分點。(3)不包含食品、能源的核心 CPI 同比為 1.0%,屬於連續第五個月改善,亦屬於 2024 年 3 月以來首次站上 1%。
第三,從 CPI 主要部分來看,值得注意的細節包括:(1)豬肉價格依然沒有止跌,9 月環比為-0.7%;(2)酒類沒有止跌,9 月環比為-0.3%;(3)和金價對應,金飾品價格上漲較為明顯;(4)租金表現中性,已連續第二個月環比零增長;(5)家用器具(家電等為主)9 月環比為 0.6%,已屬於連續第三個月環比正增長;(6)醫療服務價格趨勢略強,過去六個月環比均不低於 0.3%,9 月同比為 1.9%。
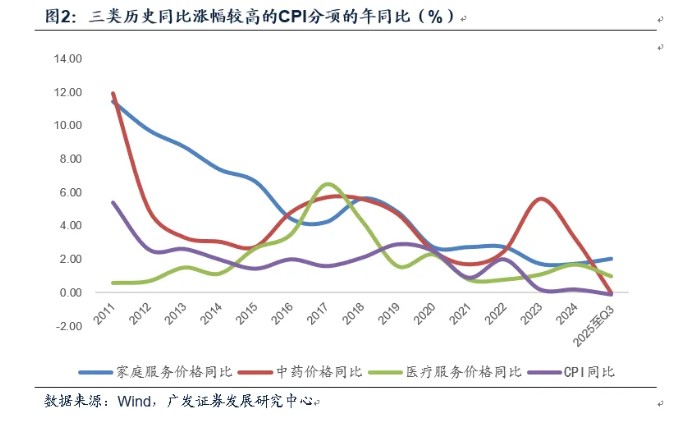
第四,CPI 中有沒有每年都是同比顯著正增長的領域?2025 年之前中藥價格是其中一個,2011-2024 年年度同比均值為 4.4%,最低一個年份同比漲幅是 1.7%,但 2025 年中藥價格勢頭放緩,前 9 個月價格同比為零增長;另一個領域是家庭服務價格,過去兩年已經放緩但每年同比依然有 1.7%,今年前 9 個月為同比 2.0%。再然後就是醫療服務價格,2011 年以來最低的年份為同比 0.6%,過去兩年同比均在 1% 以上,今年前 9 個月為 1.0%。
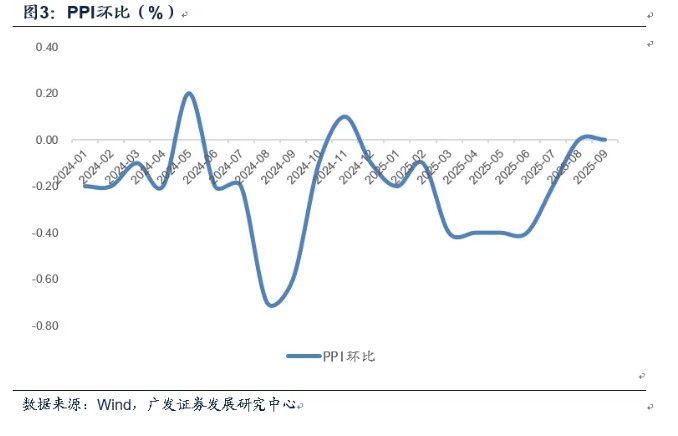
第五,PPI 雖然 9 月環比沒有轉正,但連續兩個月環比零增長,較之前連續 8 個月環比負增長還是有所改善。從主要大類來看,正貢獻之一是上游採掘,9 月環比為 1.2%,最近兩個月煤炭開採價格有明顯改善;正貢獻之二是下游一般日用品,9 月環比為 0.2%。原材料、加工品、食品、衣着變化不大。主要拖累仍來自於耐用消費品,9 月 PPI 耐用消費品環比為-0.4%。
第六,從具體行業來看,耐用消費品代表汽車製造業 9 月環比為-0.5%(前值-0.3%),累計同比降幅進一步擴大至-3.0%,這可能與這一行業創新較快有關,但它會向總量經濟輸出價格下行,約束企業利潤、推高實際利率。回顧今年前三季度,超過 PPI 累計降幅的-2.8%、對 PPI 拖累相對比較大的行業包括:(1)上游採礦和關聯加工業,其中煤炭開採累計同比-16.9%、黑色金屬冶煉累計同比-8.6%;(2)中游化工建材,其中化工累計同比-4.9%、化纖累計同比-6.7%、非金屬累計同比-3.8%;(3)中游汽車製造累計同比-3.0%;(4)下游農副食品加工累計同比-3.4%。推動相關領域的 “反內卷” 仍十分重要。和 2024 年相比,電氣機械行業價格有所改善。
第七,再來看整體宏觀面。如果我們把宏觀面拆分為量、價、流動性、風險偏好四條線,9 月 PMI、進口數據、和高頻建築業數據顯示在政策性金融工具較集中落地的背景下,項目投資有所加速,經濟有望邊際上再度企穩;10 月原油價格存在拖累,但內需商品價格仍穩,疊加 CPI 基數較低,預計價格同比仍處於弱改善趨勢中;海外存在降息窗口,國內貨幣政策維護流動性合理充裕,流動性環節基本穩定;主要不確定性在於海外關税擾動,以及它對部分領域估值問題的誘發,今年全球資產集中度較高(AI 科技、有色等領域),至一定階段後市場會對空間存在分歧。在最新週報《關於外部關税擾動:三點歷史經驗》中,我們以 2018 年以來的 “茅指數” 和 “寧組合” 為例觀察,可以看到其歷史走勢和外部關税關聯度不大,資產本身的安全邊際是更重要的定價因素。
正文
9 月 CPI 同比-0.3%,略低於我們模型預測的-0.18%,高於前值的-0.4%;PPI 同比-2.3%,和我們預測的-2.36% 基本吻合,高於前值的-2.9%。按照 CPI 和 PPI 分別 60%、40% 模擬的平減指數約為-1.10%,高於前值的-1.40%,屬於 4 月以來最高。
在報告《資產重估行至當下:約束與動能》中,我們指出:簡言之,9 月價格改善斜率先平後上,伴隨着 CPI 進入低基數期,周度平減指數有較大契機回温觸及 “-1” 附近,PPI 中的有色在首周與最後一週價格上行,中間時段國內品種有所表現。預計在月度 CPI、PPI 分別為-0.18%、-2.36% 的對應下,預計 9 月平減指數回升至-1.1%。
CPI 延續緩慢改善的特徵:(1)環比為 0.1%,略高於前值的零增長;(2)消費品價格環比上漲 0.3%,高於前值的 0.1%。[1] 扣除能源的工業消費品價格上漲 0.5%,影響 CPI 環比上漲約 0.12 個百分點。(3)不包含食品、能源的核心 CPI 同比為 1.0%,屬於連續第五個月改善,亦屬於 2024 年 3 月以來首次站上 1%。
9 月 CPI 環比為 0.1%,其中食品 CPI 環比為 0.7%(前值 0.5%);非食品 CPI 環比為-0.1%(前值-0.1%)。
9 月 CPI 消費品環比為 0.3%(前值 0.3%),服務環比為-0.3%(前值零增長)。
從 CPI 主要部分來看,值得注意的細節包括:(1)豬肉價格依然沒有止跌,9 月環比為-0.7%;(2)酒類沒有止跌,9 月環比為-0.3%;(3)和金價對應,金飾品價格上漲較為明顯;(4)租金表現中性,已連續第二個月環比零增長;(5)家用器具(家電等為主)9 月環比為 0.6%,已屬於連續第三個月環比正增長;(6)醫療服務價格趨勢略強,過去六個月環比均不低於 0.3%,9 月同比為 1.9%。
9 月豬肉價格環比-0.7%(前值-0.5%);鮮菜價格環比 6.1%,前值 8.5%。
9 月酒類價格環比-0.3%(前值-0.2%);金飾品價格環比上漲 6.5%,同比上漲 42.1%。
9 月租賃房租金環比零增長(前值零增長);家用器具環比 0.6%(前值 1.1%);交通工具環比-0.1%(前值零增長),其中交通工具用燃料環比-1.7%(前值-0.9%)。
9 月中藥、西藥、醫療服務價格環比分別為-0.1%、0、0.3%。醫療服務同比為 1.9%。
CPI 中有沒有每年都是同比顯著正增長的領域?2025 年之前中藥價格是其中一個,2011-2024 年年度同比均值為 4.4%,最低一個年份同比漲幅是 1.7%,但 2025 年中藥價格勢頭放緩,前 9 個月價格同比為零增長;另一個領域是家庭服務價格,過去兩年已經放緩但每年同比依然有 1.7%,今年前 9 個月為同比 2.0%。再然後就是醫療服務價格,2011 年以來最低的年份為同比 0.6%,過去兩年同比均在 1% 以上,今年前 9 個月為 1.0%。
在前期報告《如何看 4 月物價數據和央行貨政報告對於價格的分析》中,我們曾指出:中藥價格過去十年(2015-2024)年度同比漲幅最低也有 1.7%,漲幅均值為 3.9%。在歷史上幾乎沒有過環比負增長,2024 年下半年起價格偏弱,2024 年 9 月、2025 年 2 月、2025 年 4 月均為環比負增長。
PPI 雖然 9 月環比沒有轉正,但連續兩個月環比零增長,較之前連續 8 個月環比負增長還是有所改善。從主要大類來看,正貢獻之一是上游採掘,9 月環比為 1.2%,最近兩個月煤炭開採價格有明顯改善;正貢獻之二是下游一般日用品,9 月環比為 0.2%。原材料、加工品、食品、衣着變化不大。主要拖累仍來自於耐用消費品,9 月 PPI 耐用消費品環比為-0.4%。
9 月生產資料 PPI 中,採掘工業環比為 1.2%(前值 1.3%);原材料工業環比為零增長(前值 0.2%);加工工業環比為-0.1%(前值零增長)。煤炭開採業價格最近兩個月有所改善,8 月和 9 月環比分別為 2.8%、2.5%。
9 月生活資料 PPI 中,食品類環比為-0.1%(前值 0.1%);衣着類環比為零增長(前值零增長);一般日用品類環比為 0.2%(前值-0.2%);耐用消費品類環比為-0.4%(前值為-0.3%)。
從具體行業來看,耐用消費品代表汽車製造業 9 月環比為-0.5%(前值-0.3%),累計同比降幅進一步擴大至-3.0%,這可能與這一行業創新較快有關,但它會向總量經濟輸出價格下行,約束企業利潤、推高實際利率。回顧今年前三季度,超過 PPI 累計降幅的-2.8%、對 PPI 拖累相對比較大的行業包括:(1)上游採礦和關聯加工業,其中煤炭開採累計同比-16.9%、黑色金屬冶煉累計同比-8.6%;(2)中游化工建材,其中化工累計同比-4.9%、化纖累計同比-6.7%、非金屬累計同比-3.8%;(3)中游汽車製造累計同比-3.0%;(4)下游農副食品加工累計同比-3.4%。推動相關領域的 “反內卷” 仍十分重要。和 2024 年相比,電氣機械行業價格有所改善。
在 2024 年底報告《重塑廣譜性增長》中,我們曾指出:從 2024 年 PPI 價格的下行來看,主要拖累之一來需求不足的建築產業鏈行業,如煤炭(-8.4%,前 10 個月累計,下同)、黑色冶煉(-6.0%)、非金屬(-7.0%)、化工(-5.6%);之二是供給增長較快的新產業,如電氣機械(-3.5%)、汽車(-2.1%)、計算機通信電子(-2.4%)。
和當時相比,今年前三季度電氣機械行業價格同比-1.8%,有較明顯改善,其背後一則是光伏等行業價格秩序有所改善;二則是家電已價換量促銷的情況有所改善。
再來看整體宏觀面。如果我們把宏觀面拆分為量、價、流動性、風險偏好四條線,9 月 PMI、進口數據、和高頻建築業數據顯示在政策性金融工具較集中落地的背景下,項目投資有所加速,經濟有望邊際上再度企穩;10 月原油價格存在拖累,但內需商品價格仍穩,疊加 CPI 基數較低,預計價格同比仍處於弱改善趨勢中;海外存在降息窗口,國內貨幣政策維護流動性合理充裕,流動性環節基本穩定;主要不確定性在於海外關税擾動,以及它對部分領域估值問題的誘發,今年全球資產集中度較高(AI 科技、有色等領域),至一定階段後市場會對空間存在分歧。在最新週報《關於外部關税擾動:三點歷史經驗》中,我們以 2018 年以來的 “茅指數” 和 “寧組合” 為例觀察,可以看到其歷史走勢和外部關税關聯度不大,資產本身的安全邊際是更重要的定價因素。逆全球化關税落地且影響超預期;再次出現微觀上的 “搶出口” 節奏;部分產品面臨外部特定行業關税;新型政策性金融工具對基建的支撐力度強於預期。
本文作者:廣發宏觀郭磊,原文來源:郭磊宏觀茶座,原文標題:《如何認識最新的價格數據和當前宏觀面》
風險提示及免責條款
市場有風險,投資需謹慎。本文不構成個人投資建議,也未考慮到個別用户特殊的投資目標、財務狀況或需要。用户應考慮本文中的任何意見、觀點或結論是否符合其特定狀況。據此投資,責任自負。
