Wind: In the first three quarters of 2025, the equity financing scale of the US stock market totaled 148.1 billion USD

In the first three quarters of 2025, the total equity financing in the US stock market reached USD 148.1 billion, a year-on-year increase of 16.40%. Among them, IPO financing was USD 46.9 billion, SPAC financing was USD 16.2 billion, and refinancing was USD 101.2 billion. A total of 310 companies successfully went public, with the non-bank financial sector raising USD 49.9 billion. Goldman Sachs ranked first in IPO underwriting, while JPMorgan Chase ranked first in refinancing
According to the Zhitong Finance APP, on October 14th, Wind released the ranking of equity underwriting in the US stock market for the first three quarters of 2025. The US stock market performed strongly in the first three quarters of 2025. In terms of core indices, the Dow Jones Industrial Average rose by 9.06%, the Nasdaq Index increased by 17.34%, and the S&P 500 Index saw a rise of 13.72%. According to Wind's data statistics, the total scale of equity financing (including IPOs and refinancing) in the US stock market for the first three quarters of 2025 reached USD 148.1 billion, an increase of USD 20.9 billion compared to the same period last year, with a growth rate of 16.40%. Among them, the non-bank financial sector (including SPAC listings as non-bank financing) raised a total of USD 49.9 billion, accounting for 33.68%.
In terms of IPOs, a total of 310 companies successfully went public in the first three quarters of 2025, an increase of 128 companies compared to the same period last year; the total financing amount reached USD 46.9 billion, a year-on-year increase of 50.07%; the largest fundraising was by Venture Global, which raised a total of USD 1.75 billion. In terms of SPACs, there were 85 IPO financing cases in the first three quarters of 2025, an increase of 56 cases year-on-year; the total financing amount reached USD 16.2 billion, a year-on-year increase of 190.93%. For Chinese concept stocks, small and medium-sized enterprises dominated the IPOs in the US in the first three quarters, with a total of 59 companies listed, an increase of 20 companies year-on-year; the total financing amount was only USD 1 billion, a year-on-year decrease of 58.35%.
In terms of refinancing, there were 665 refinancing events in the first three quarters of 2025, an increase of 16 events compared to the same period last year; the total refinancing scale reached USD 101.2 billion, a year-on-year increase of 5.42%.
From the underwriting perspective, in terms of IPOs, Goldman Sachs ranked first in the IPO underwriting list with an underwriting amount of USD 4.758 billion, underwriting 29 companies; Cantor Fitzgerald ranked second with an underwriting amount of USD 4.646 billion, underwriting 26 companies; JPMorgan Chase ranked third with an underwriting amount of USD 4.508 billion, underwriting 25 companies. In terms of refinancing, JPMorgan Chase ranked first with an underwriting scale of USD 15.458 billion, with 58 underwriting cases; Goldman Sachs ranked second with an underwriting scale of USD 12.731 billion, with 53 underwriting cases; Morgan Stanley ranked third with an underwriting amount of USD 11.253 billion, with 59 underwriting cases.
Overview of the Equity Financing Market
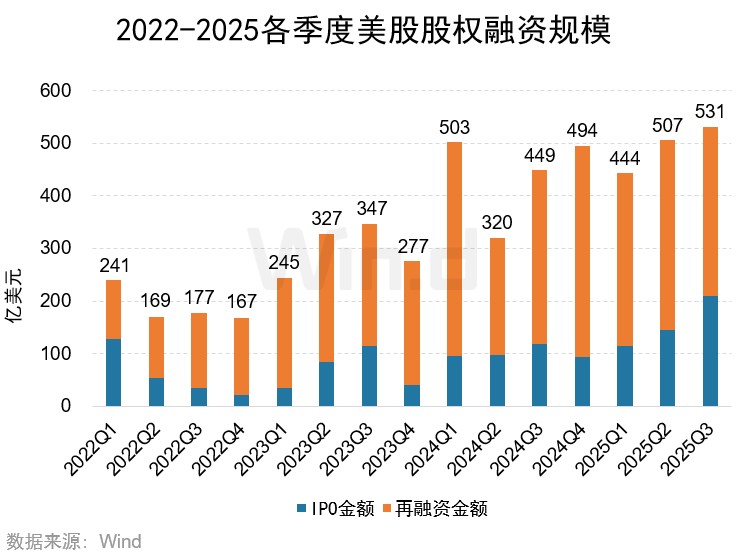
1.1 Trend of Equity Financing Scale
In the first three quarters of 2025, the total scale of equity financing in the primary market of the US stock market reached USD 148.1 billion, an increase of 16.40% compared to the same period last year. Among them, the IPO financing scale was USD 46.9 billion, a year-on-year increase of 50.07%; the refinancing scale was USD 101.2 billion, a year-on-year increase of 5.42%.
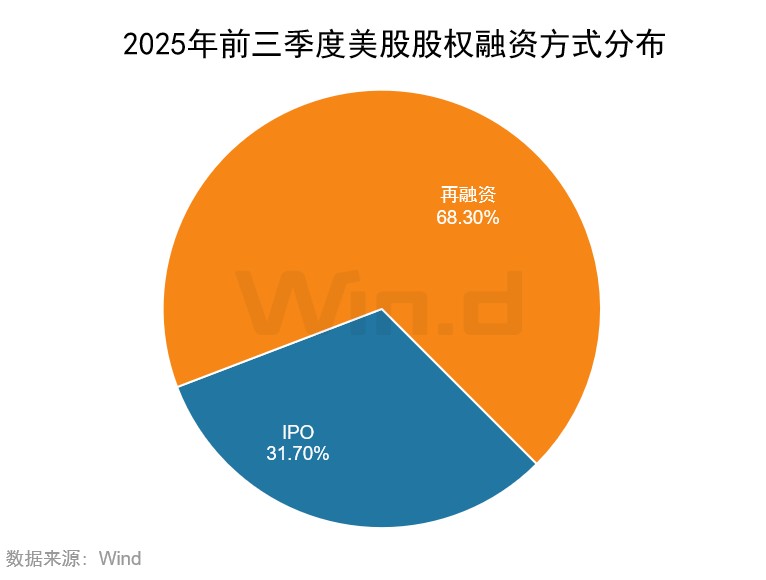
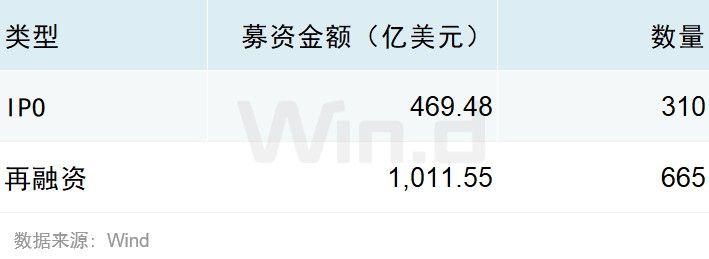
1.2 Distribution of Financing Methods From the perspective of specific financing methods, the total IPO financing scale in the first three quarters of 2025 reached USD 46.948 billion, accounting for 31.70% of the total scale of equity financing in the primary market; the refinancing scale was USD 101.155 billion, accounting for 68.30%.
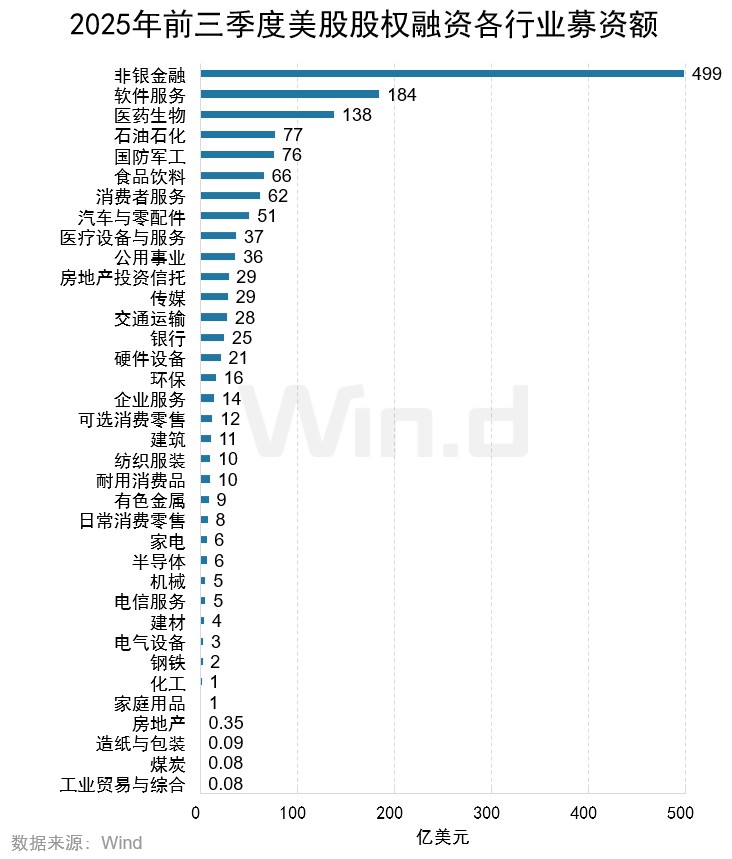
1.3 Distribution of Financing Entities by Industry
In terms of financing distribution across various industries, the non-bank financial industry ranks first with a total financing scale of USD 49 billion; the software services industry ranks second with a total financing scale of USD 18.4 billion; the pharmaceutical and biotechnology industry ranks third with a financing scale of USD 13.8 billion.
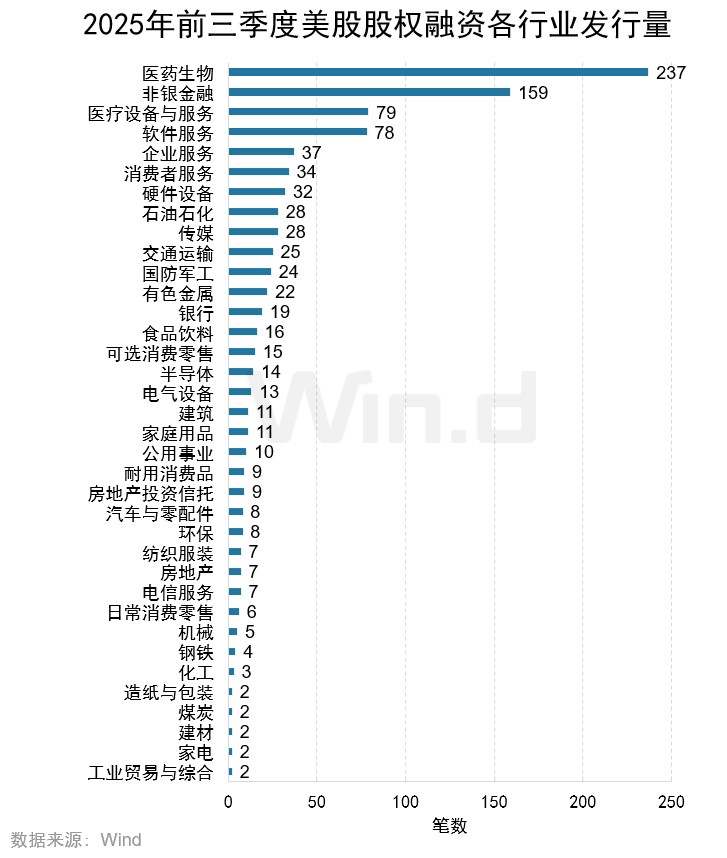
In terms of the number of financing events by industry, the pharmaceutical and biotechnology industry leads with 237 financing events; the non-bank financial industry follows with 159 financing events; the medical devices and services industry ranks third with 79 financing events.
Initial Public Offerings
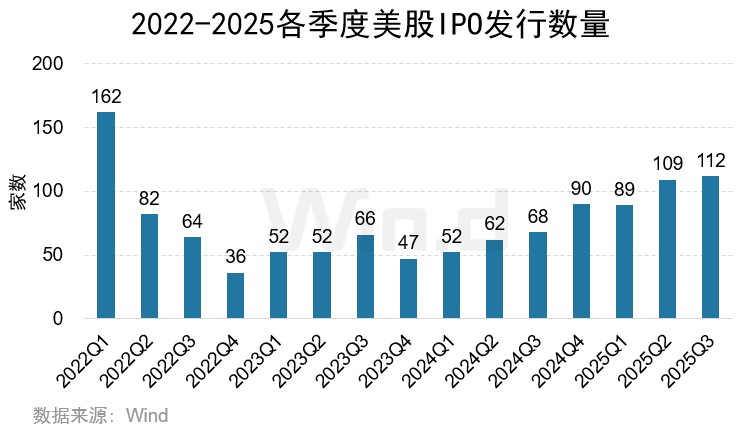
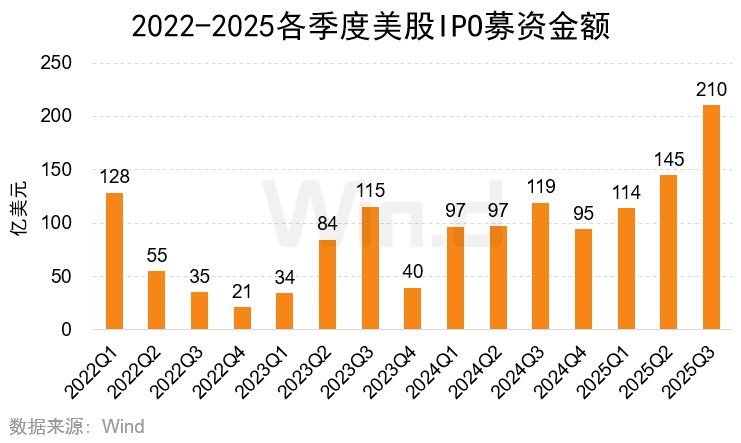
2.1 Trends in IPO Issuance Numbers and Financing Scale
In the first three quarters of 2025, a total of 310 companies successfully went public in the U.S. stock market, an increase of 128 companies year-on-year; the total financing amount reached USD 46.9 billion, an increase of 50.07% year-on-year.
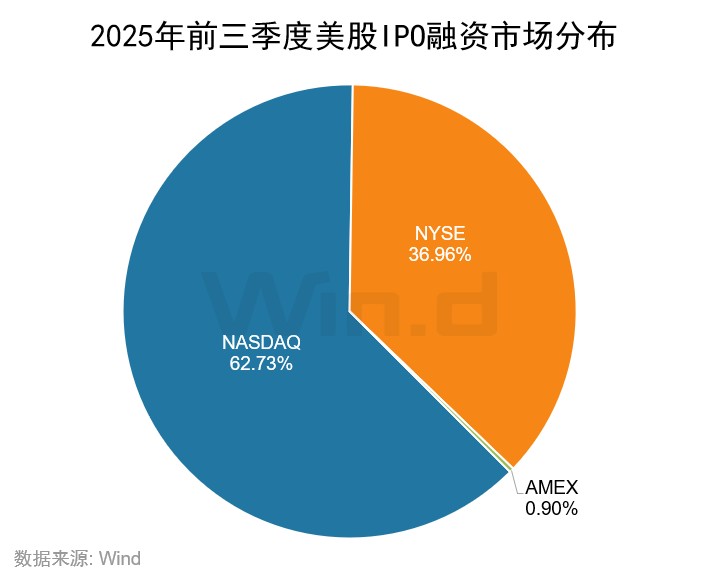
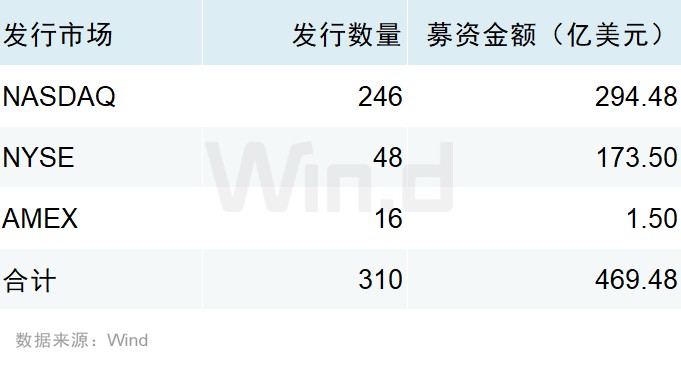
2.2 Distribution of the IPO Market
In terms of IPO market distribution, in the first three quarters of 2025, the Nasdaq remained the market with the highest number of IPOs in the U.S. stock market, with 246 companies going public, raising a total of USD 29.448 billion, accounting for 62.73% of the total scale of the U.S. stock market; the New York Stock Exchange had 48 IPOs, raising a total of USD 17.350 billion, accounting for 36.96% of the total scale of the U.S. stock market; The AMEX exchange achieved 16 IPOs, raising a total of $150 million.
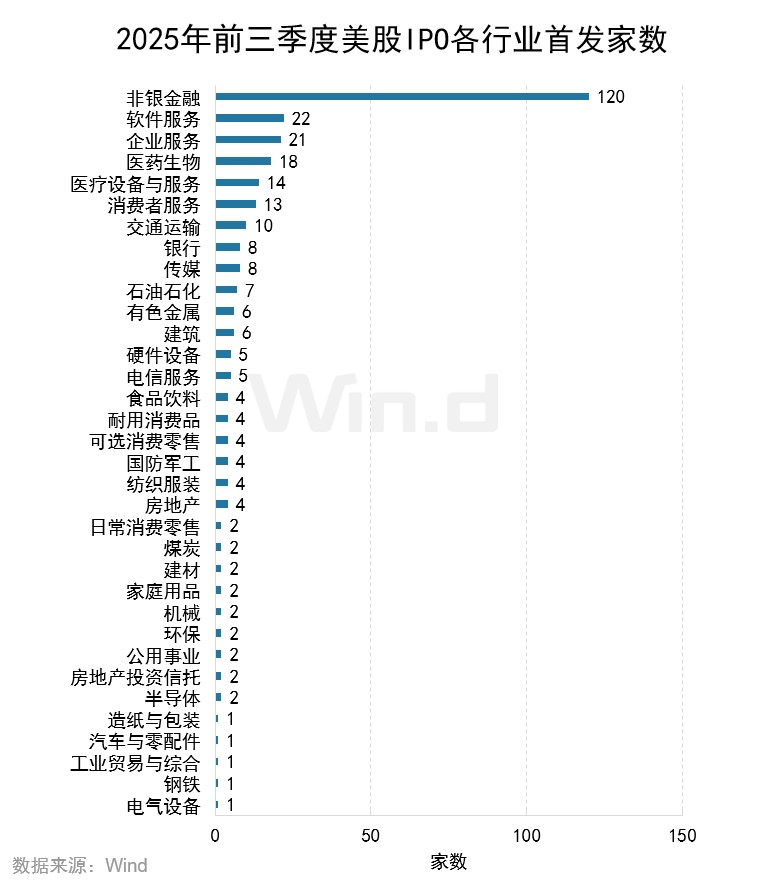
2.3 Distribution of IPO Listing Subjects by Industry
From the perspective of industry distribution of listing subjects, the highest fundraising scale for IPOs is in the non-bank financial sector, with a fundraising amount of $25.6 billion; the software services industry ranks second with a fundraising amount of $6.4 billion; the oil and petrochemical industry ranks third with a fundraising scale of $2.6 billion.
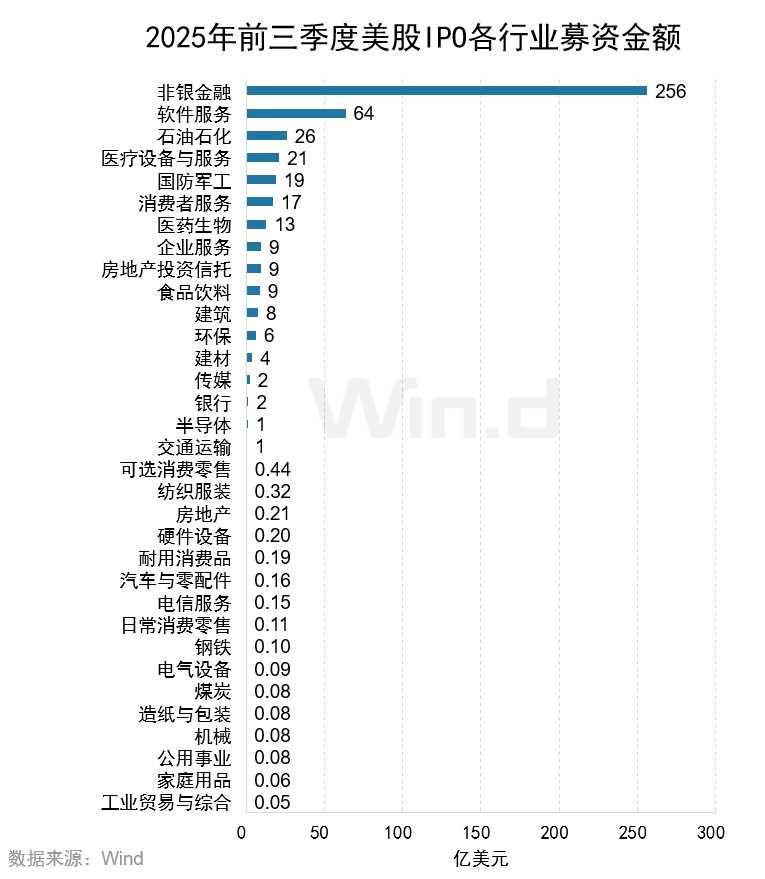
In terms of the number of IPOs issued by each industry, the non-bank financial sector ranks first with a total of 120 IPO projects; the software services industry ranks second with 22 projects, and the enterprise services sector ranks third with 21 projects.
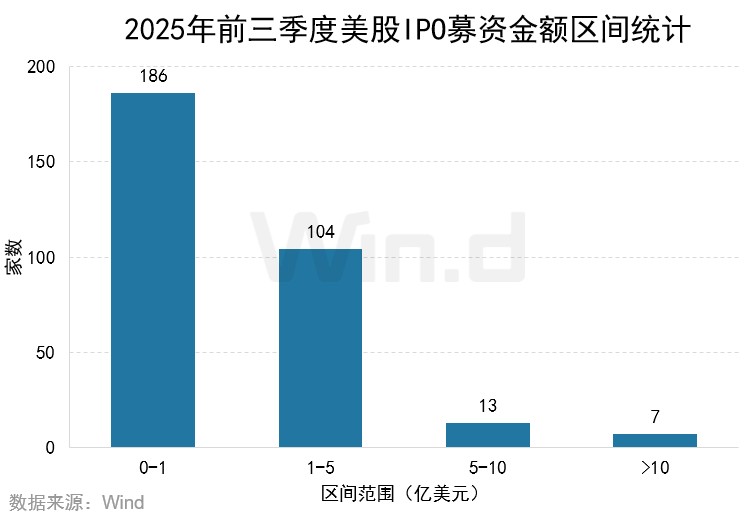
2.4 Statistics on IPO Financing Amount Ranges
In the US stock market, the number of companies with IPO financing scales of $100 million and below is 186, accounting for 60% of the total IPOs; the number of companies with financing scales between $100 million and $500 million is 104; there are 13 companies in the $500 million to $1 billion range, and 7 companies above $1 billion.
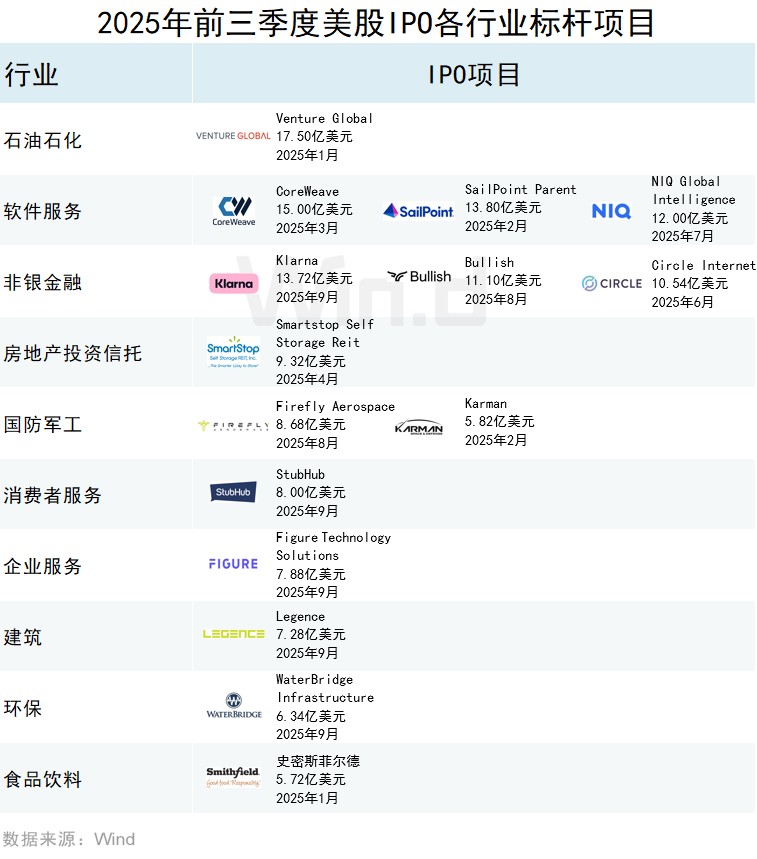
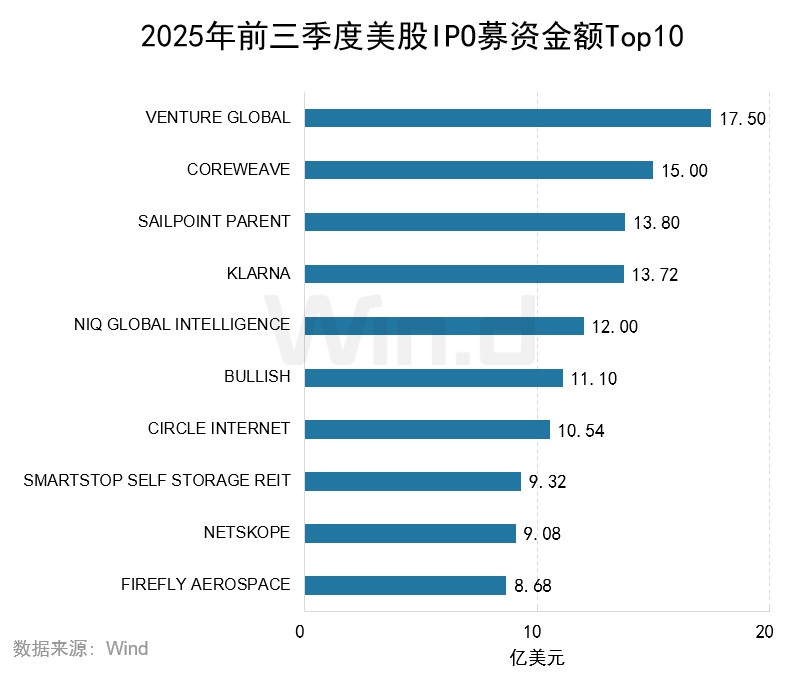
2.5 Top 10 IPO Financing Amounts
The company with the highest IPO financing amount is Venture Global, at $1.75 billion; CoreWeave and SailPoint Parent rank second and third with $1.5 billion and $1.38 billion, respectively. The top ten IPO projects raised a total of $12.074 billion, accounting for 25.72% of the total IPO fundraising amount
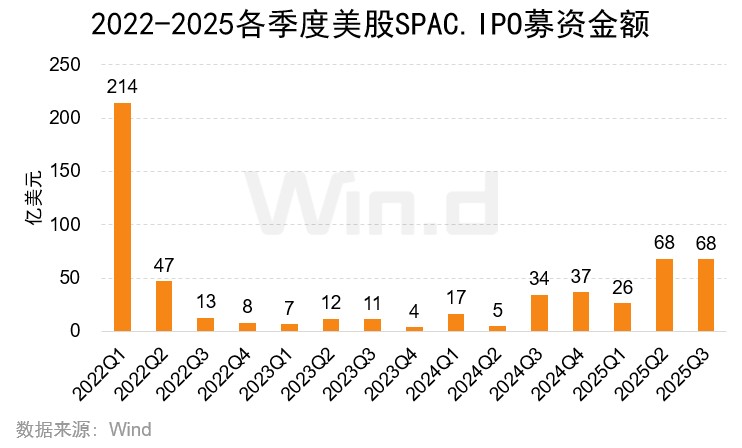
2.6 SPAC IPO Issuance Quantity and Financing Scale
In the first three quarters of 2025, a total of 85 SPACs went public, an increase of 56 compared to the same period last year; the raised funds amounted to $16.2 billion, a significant increase of 190.93% year-on-year.
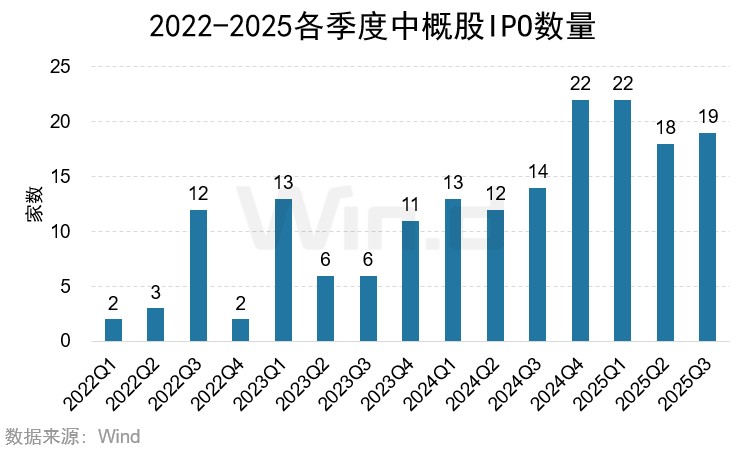
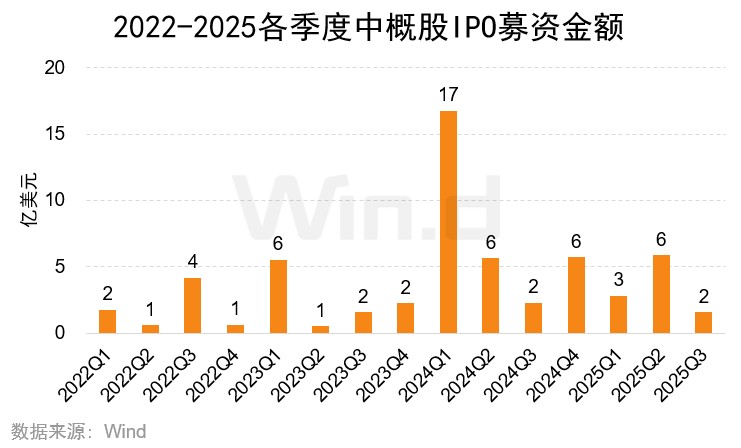
2.7 Chinese Concept Stock IPO Issuance Quantity and Financing Scale
In the first three quarters of 2025, a total of 59 Chinese companies went public in the U.S., an increase of 20 compared to the same period last year, with a financing scale of $1 billion, a decrease of 58.35% year-on-year. Only 2 leading companies raised over $100 million, namely Bawang Chaji ( $411 million) and Ascentage Pharma ( $126 million).
Refinancing Section
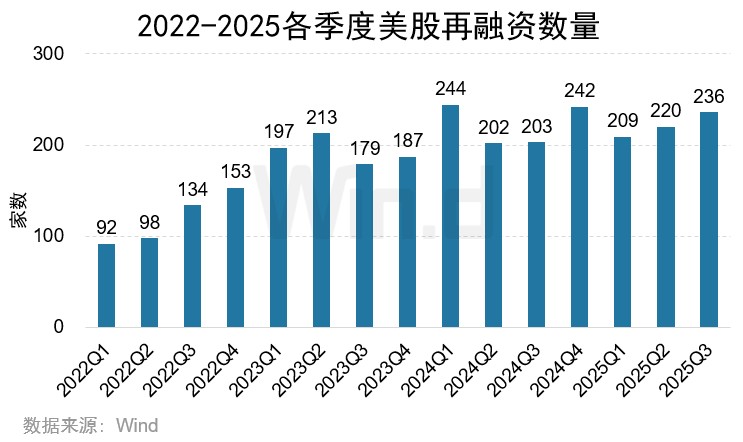
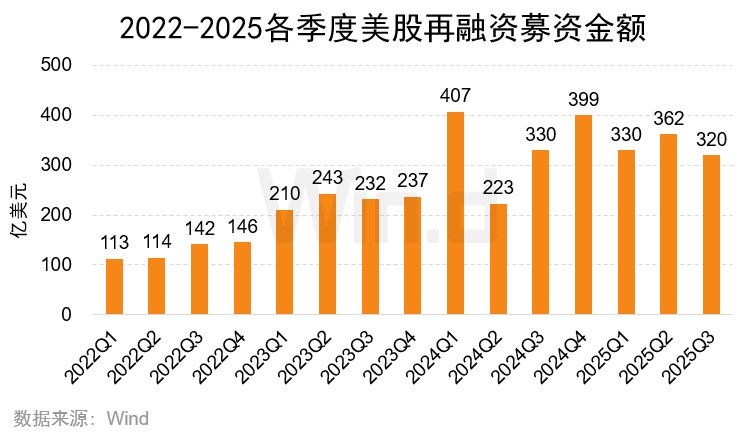
3.1 Refinancing Trends
In the first three quarters of 2025, the total amount raised through refinancing in the U.S. stock market was $101.2 billion, an increase of 5.42% compared to the same period last year; there were 665 refinancing events, an increase of 2.47% year-on-year.
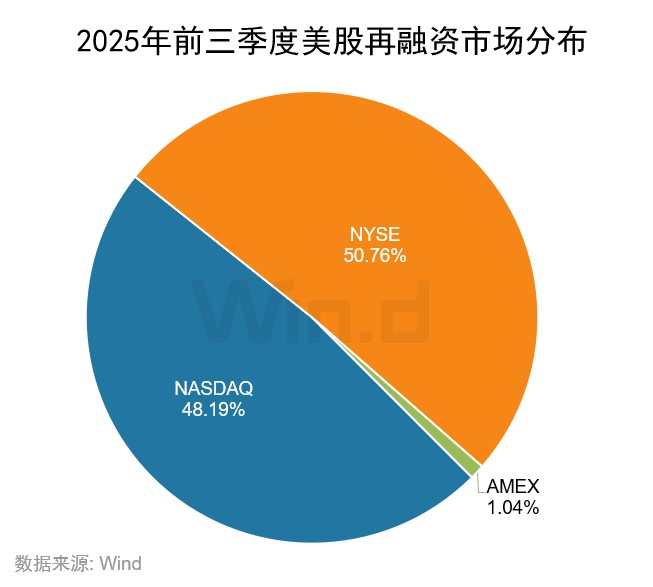
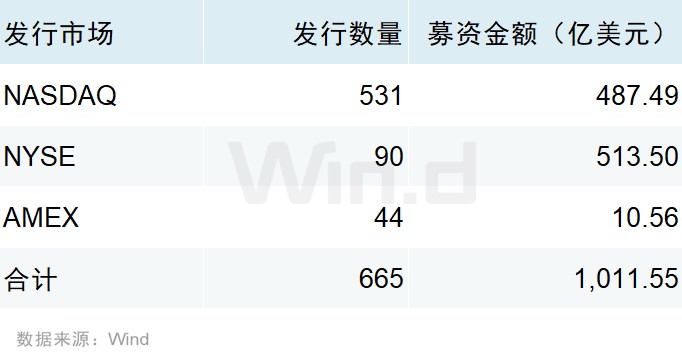
3.2 Market Distribution of Refinancing Projects
From the market distribution perspective, in the first three quarters of 2025, the Nasdaq market had the highest number of refinancing events, totaling 531, with a refinancing scale of $48.749 billion; the New York Stock Exchange had a total of 90 refinancing events, raising $51.35 billion; the AMEX exchange had only 44 refinancing projects, raising $1.056 billion
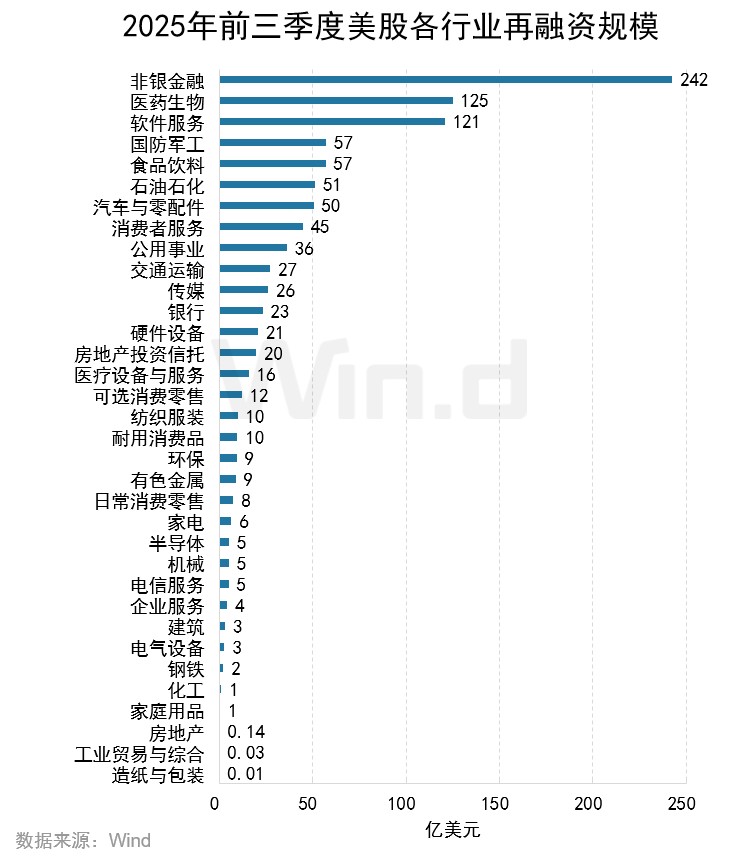
3.3 Industry Distribution of Refinancing Entities
In the first three quarters of 2025, the industry with the highest amount raised through refinancing was non-bank financials, with a refinancing scale of $24.2 billion; the software services industry ranked second with $12.5 billion raised; and the pharmaceutical and biotechnology industry ranked third with $12.1 billion raised.
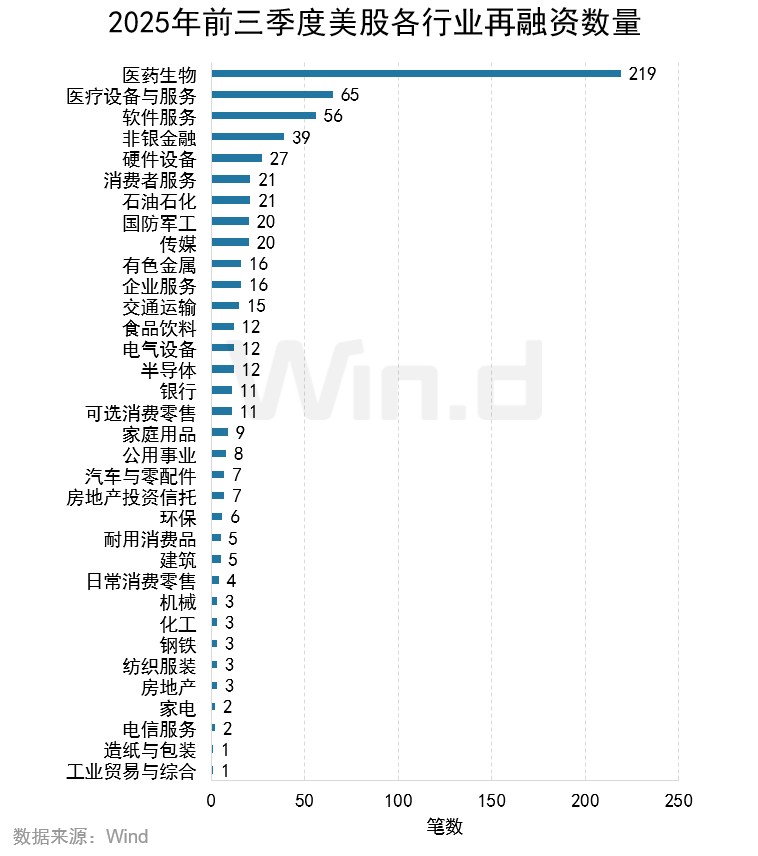
In terms of the number of refinancing cases, the pharmaceutical and biotechnology industry had 219 cases, ranking first; the medical devices and services industry ranked second with 65 cases; and the software services industry ranked third with 56 cases.
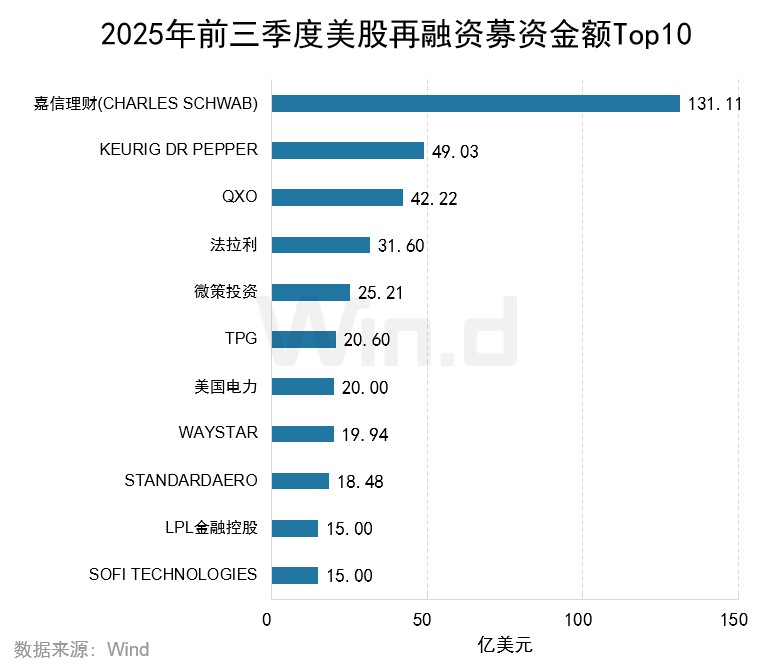
3.4 Top 10 Refinancing Projects
The company with the highest refinancing amount in the first three quarters of 2025 was Charles Schwab, with $13.111 billion; Keurig Dr Pepper and QXO ranked second and third with $4.903 billion and $4.222 billion, respectively.
Institutional Section
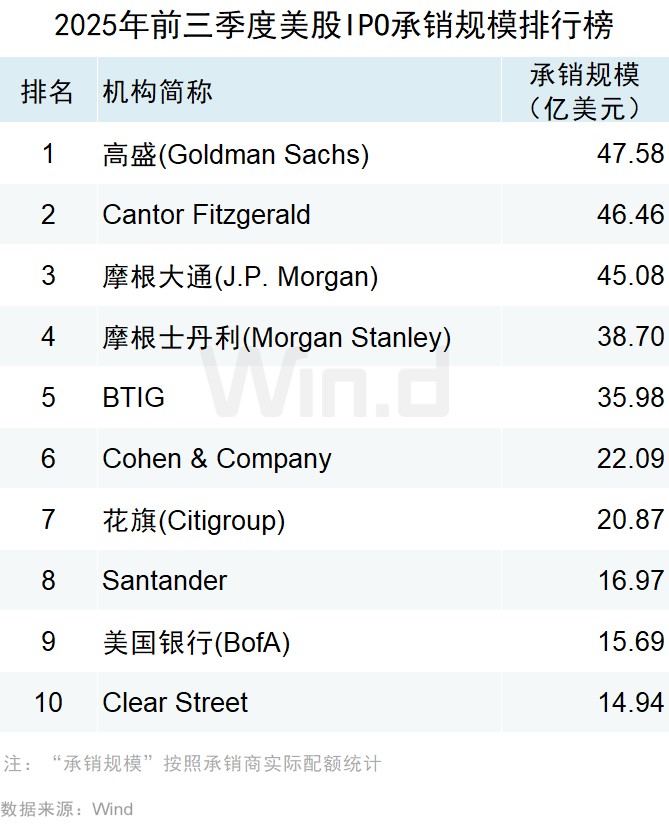
4.1 IPO Underwriting Scale Ranking
In the first three quarters of 2025, in terms of IPO underwriting amounts, Goldman Sachs ranked first with an underwriting amount of $4.758 billion and 29 deals; Cantor Fitzgerald ranked second with $4.646 billion and 26 deals; and JPMorgan Chase ranked third with $4.508 billion and 25 deals.
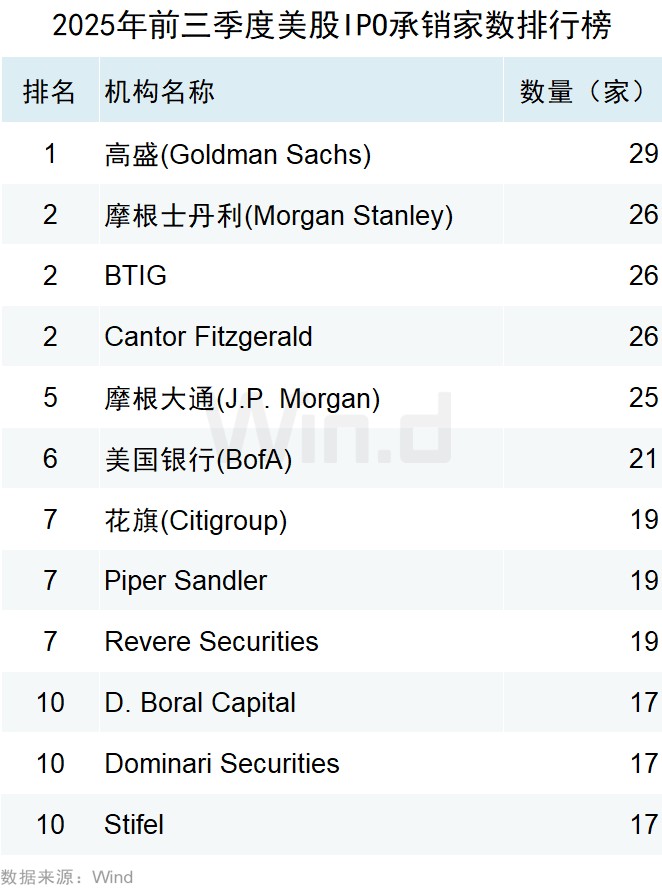
 4.2 IPO Underwriting Ranking
In terms of the number of IPO underwritings, Goldman Sachs ranks first with participation in 29 IPO underwriting projects; Morgan Stanley, BTIG, and Cantor Fitzgerald are tied for second place with participation in 26 each.
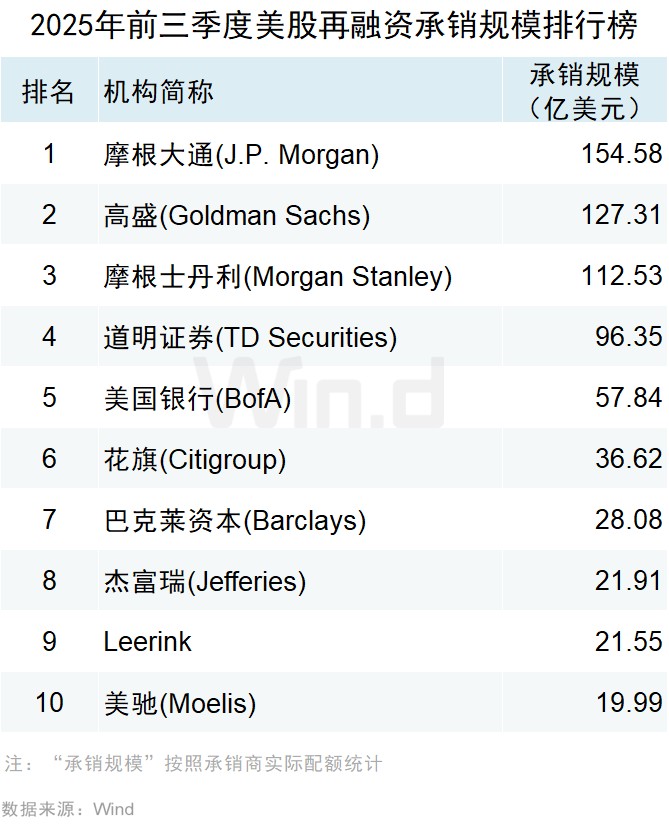
4.3 Refinancing Underwriting Scale Ranking
In refinancing, JPMorgan Chase ranks first with an underwriting scale of $15.458 billion and 58 underwriting cases; Goldman Sachs ranks second with an underwriting scale of $12.731 billion and 53 underwriting cases; Morgan Stanley ranks third with an underwriting amount of $11.253 billion and 59 underwriting cases.
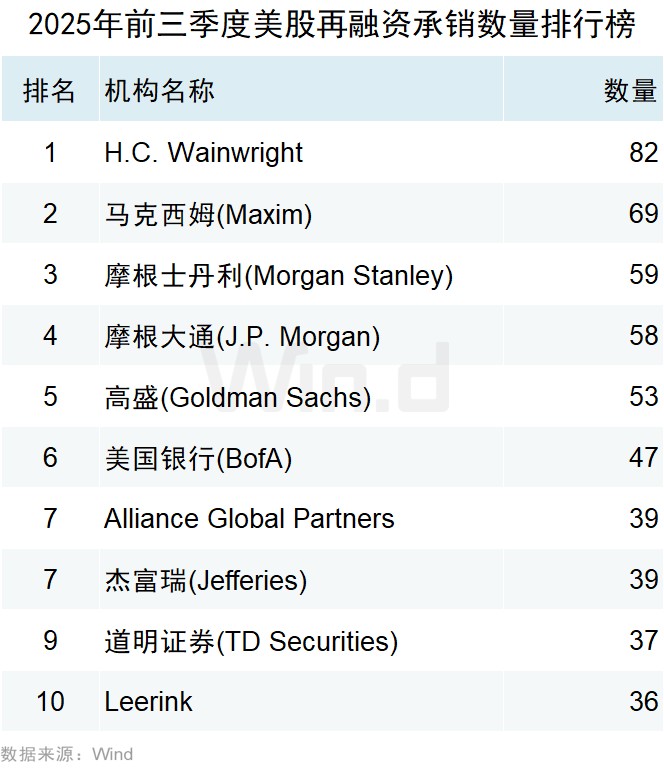
4.4 Refinancing Underwriting Quantity Ranking
H.C. Wainwright participated in 82 refinancing events in the first three quarters of 2025, ranking first in the refinancing underwriting quantity ranking; Maxim ranks second with 69 refinancing underwritings; Morgan Stanley ranks third with 59 refinancing underwritings.
Issuing Intermediary Section
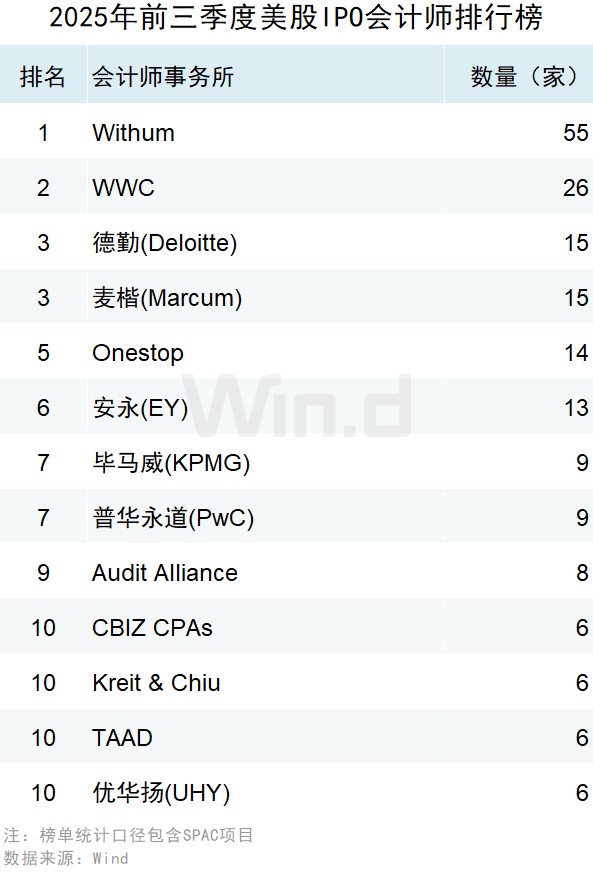
5.1 IPO Accountant Ranking
Withum ranks first in the accountant ranking with participation in 55 IPOs of listed companies; WWC ranks second with participation in 26 companies' IPO projects; Deloitte and Marcum rank third with participation in 15 companies' IPO projects.
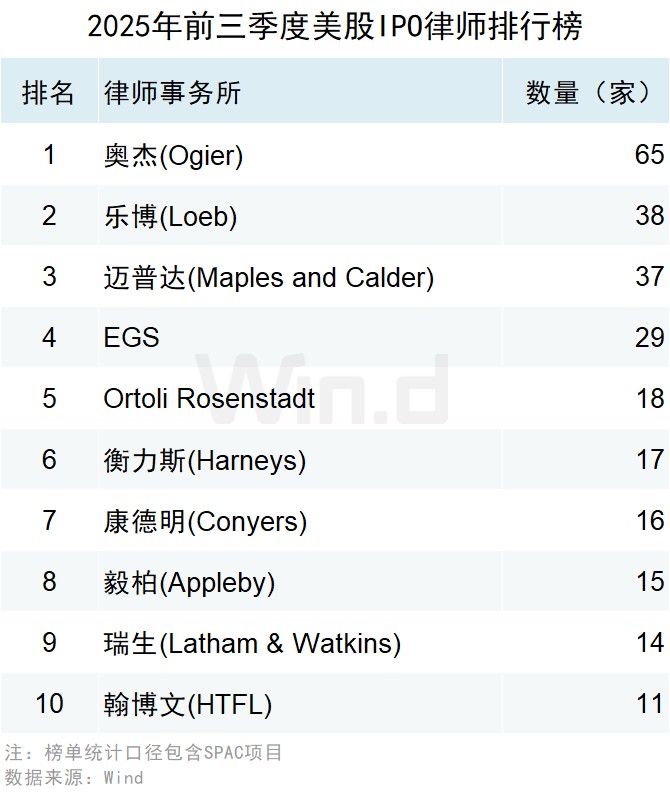
5.2 IPO Lawyer Ranking
In terms of IPO lawyers, Ogier participated in 65 companies' IPO projects, ranking first; Loeb participated in 38, ranking second; Maples and Calder participated in 37, ranking third.