
CICC: Expect the liquidity environment between China and the U.S. to continue resonating in September and October, continue to overweight A-shares, Hong Kong stocks, and gold

中金髮布研報,預計 9-10 月中美流動性環境將繼續共振,美元處於下行週期,利好各類資產。建議超配 A 股、港股和黃金,認為 A 股和港股相對美股性價比更高。美聯儲降息節奏可能在 “快 - 慢 - 快” 之間切換,預計將對中外經濟和資產表現產生深遠影響。
智通財經 APP 獲悉,中金髮布研報稱,預期 9 月-10 月中美流動性環境延續共振,美元處於下行週期,對各類資產 (股票、債券、黃金、商品) 形成利好。與 9 月市場行情類似,10 月可能仍是宏觀相對順風期,建議維持相對較高的風險偏好,超配中國股票。目前滬深 300 指數動態市盈率接近歷史均值,估值與此前牛市高點比還有擴張空間。
綜合風險收益,A 股和港股相對美股的配置性價比更高。由於宏觀流動性趨於寬鬆,且美聯儲獨立性與美元信譽受損,維持超配黃金。黃金年初以來上漲幅度較快,已經超出與基本面相匹配的水平,近期再度快速上漲,短期回調風險有所上升,建議淡化黃金交易價值,關注長期配置價值,逢低增配。
中金主要觀點如下:
美聯儲降息節奏可能在 “快 - 慢-快” 之間切換
美聯儲 9 月重啓降息,美元寬鬆週期進入新階段,或對中外經濟運行與資產表現產生深遠影響。基準預期是美聯儲降息週期可能分為 “快 - 慢-快” 3 個階段:
2025Q4 是第一階段,降息節奏較快:由於通脹 8 月剛確認上行拐點,絕對水平不高,且美聯儲可以用 “暫時性” 現象淡化通脹壓力,而就業下行風險比通脹上行風險更迫切,所以 “穩增長” 的優先級高於 “控通脹”。
圖表 1:美國通脹已確認上行拐點,未來 3 個季度或持續抬升
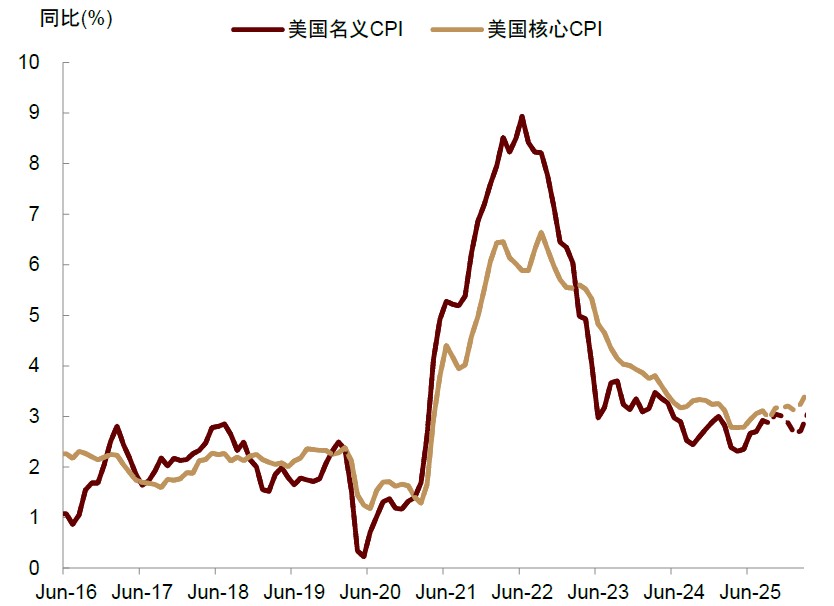
資料來源:Haver,中金公司研究部
疊加特朗普施加較大政治壓力,預計美聯儲可能降息節奏較快,或連續降息 3-4 次。
2026H1 為第二階段,降息節奏放慢。隨着通脹持續上行,美聯儲或需重新平衡增長下行與通脹上行風險,無法持續快速降息,可能用停止 “縮表” 來安撫金融市場。
2026H2 為第三階段,降息節奏再次加速。由於 2026 年 5 月鮑威爾任期屆滿,預計特朗普政府大概率提名更鴿派的美聯儲主席上台,並且關税對通脹的推升效果也可能告一段落,美聯儲可能重新加快降息節奏。總結來看,未來一年美聯儲寬鬆是大勢所趨,寬鬆交易是全球市場主線,或推動美元貶值,總體利好中外股債商金等各類資產。
圖表 2:美元下行期,黃金、商品、股票趨於上漲,非美股票跑贏美國股票
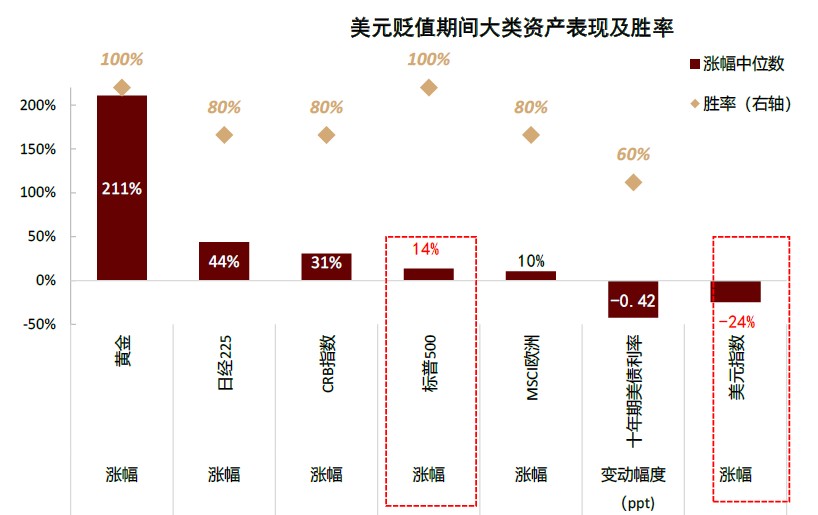
資料來源:Haver,中金公司研究部
但在美聯儲寬鬆節奏的快慢切換時點,例如今年年末或 2026 年年中,可能對全球資產走勢形成衝擊。由於當下美聯儲政策制定並非只依賴經濟數據,同時也受到特朗普政府影響,美聯儲獨立性受到一定衝擊,美國貨幣政策的可預見性弱化,不排除未來實際政策路徑偏離上述基準預測的可能性。但基於當前經濟與市場形勢,“快 - 慢-快” 的寬鬆節奏可能是兑現概率較高、阻力最小的政策路徑。
美聯儲降息後的經濟路徑:經濟指標拐點的全景追蹤框架
美國經濟當前仍在走向滯脹 (增長下行 + 通脹上行) 或衰退 (增長下行 + 通脹下行),滯脹可能性高於衰退。但考慮到美聯儲已經重啓寬鬆週期,且 2026 年財政赤字可能重回擴張,政策推動之下,美國增長在未來某個時點最終會掉頭上行。
圖表 3: 美國赤字率或在 2025 年下降,但 2026 年重回擴張 (數值越負説明赤字率越高)
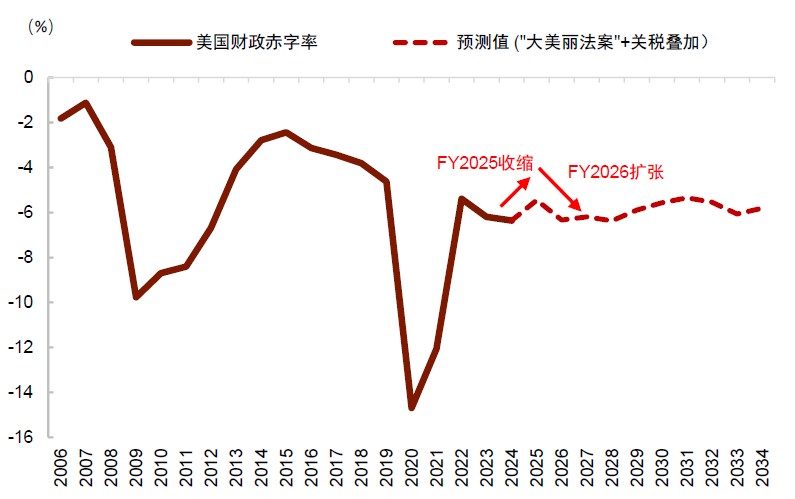
資料來源:CBO,Haver,中金公司研究部
在通脹上行期間,如果增長轉為上行,將形成一種新的市場情景——過熱 (增長上行 + 通脹上行)。
圖表 4:美國經濟的三種情境:政策過度擴張則滯脹或過熱,政策支持不足則衰退
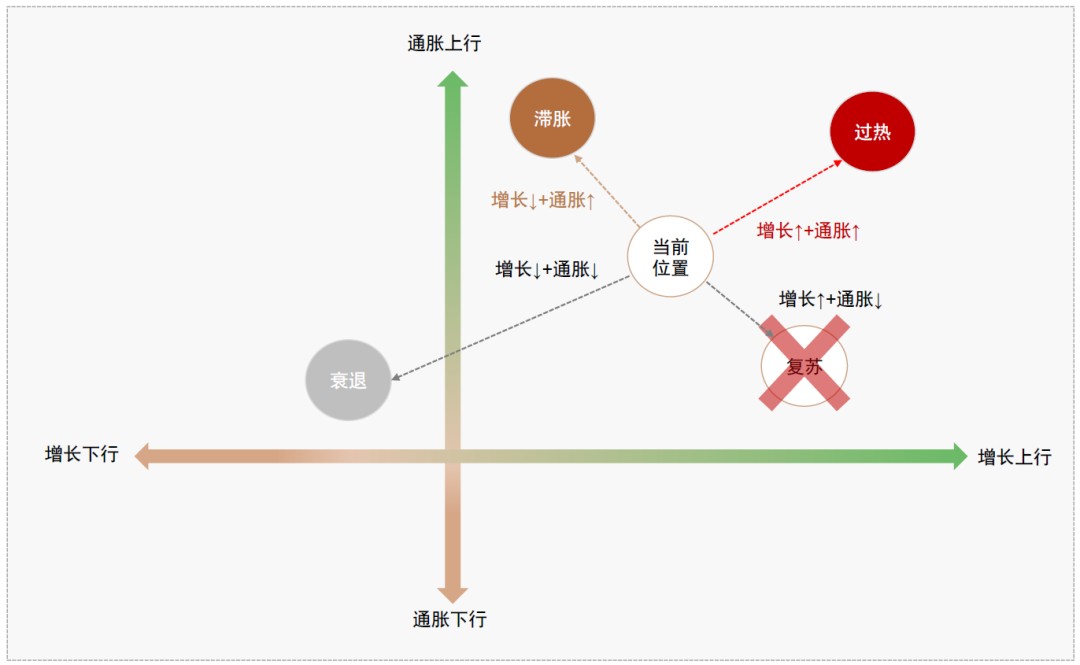
資料來源:中金公司研究部
如果政策對經濟支持較多則增長與通脹同步上行,支持不足則增長下行,因此復甦 (“軟着陸” 或 “金髮女郎”,增長上行 + 通脹下行) 出現概率較低,本文不作討論。
覆盤了 1970 年代以來 11 輪美聯儲降息週期,發現從降息啓動到增長上行拐點之間平均需要 12 個月。本輪美聯儲降息週期始於 2024 年 9 月,至今剛好 12 個月,增長拐點似乎已經不遠,因此資產配置有必要考慮經濟未來轉向過熱的可能性。
圖表 5:美聯儲降息週期中,核心經濟變量拐點的先後順序大致為 “地產->調查->就業->消費->投資->庫存->信貸”
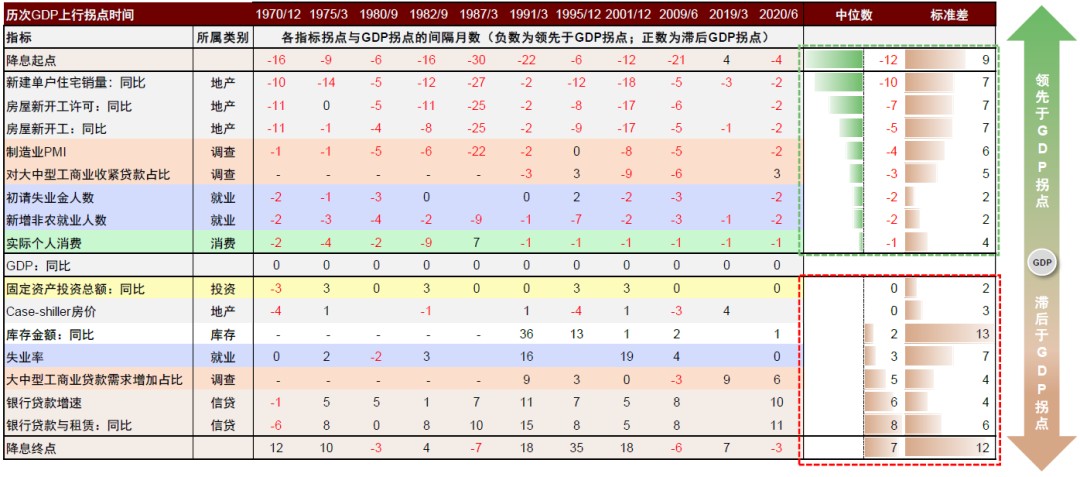
* 注:圖中的數字為歷次降息推動的增長週期拐點中,各項指標拐點與 GDP 同比的上行拐點之間間隔的月份數,負數代表指標拐點出現在 GDP 同比的拐點之前,正數代表指標拐點出現在 GDP 同比的拐點之後;將各項指標從上到下按照相對 GDP 拐點 “領先 - 滯後” 的順序依次排列 資料來源:Wind,Bloomberg,中金公司研究部
進一步研究發現,從降息時點到增長拐點的時間間隔其實方差較大,快則同時發生,慢則相差 30 個月,因此簡單套用歷史平均間隔,難以準確預測增長拐點時間。建議通過追蹤關鍵經濟指標的拐點順序,根據不同經濟變量之間相對穩定的領先 - 滯後關係,預測經濟轉向的大致節奏。
具體來講,使用 16 個核心經濟數據構建了一個指標拐點的數據庫,追蹤在過去 11 輪降息週期中的拐點規律。發現增長上行拐點往往遵循 “地產->調查->就業->消費->投資->庫存->信貸” 的先後順序。消費和就業數據是最值得關注的數據,在其確認拐點後,經濟大盤一般較快確認增長上行拐點。在就業數據中,失業率其實是一個滯後變量,拐點在增長拐點之後,因此如果美聯儲過度依賴失業率拐點做決策,可能誤導政策方向。銀行信貸理論上來講對利率敏感,但拐點其實也相當滯後,未必及時提供前瞻性信號。地產數據是明確的前瞻指標,但是地產拐點與經濟拐點的間隔方差較大,例如在 1984 年與 2000 年降息週期中,增長拐點要在地產拐點之後 1-2 年才出現。
圖表 6:美國曆次降息週期與經濟大盤拐點
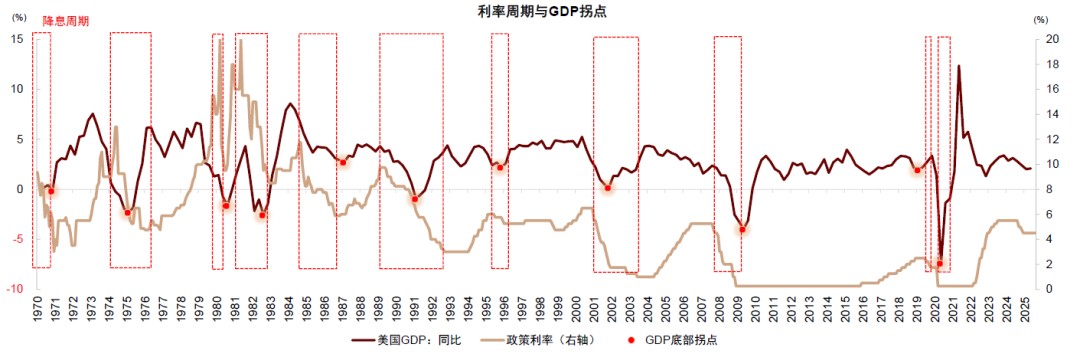
資料來源:Wind,Bloomberg,中金公司研究部
因此,儘管最近美國新房銷售出現反彈跡象,但如果沒有其他數據交叉佐證,不能得出經濟增長拐點已經接近的結論。
圖表 7:美國新建單户住宅銷量 8 月明顯反彈
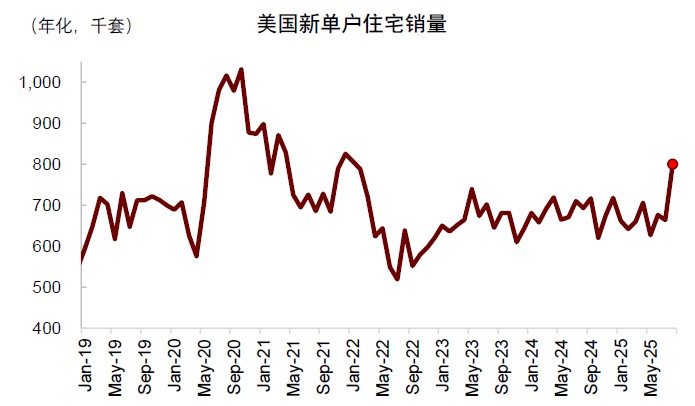
資料來源:Haver,中金公司研究部
根據上述指標體系,建議採取以下策略:在消費與就業數據確認上行拐點之前,進行寬鬆交易或滯脹交易;消費與就業拐點之後,考慮切換為過熱交易。
美聯儲降息如何影響市場?10 月仍是中美流動性共振窗口期,寬鬆交易或為市場主線。
在 8 月,提示由於美國與中國流動性趨於寬鬆,且距離 11 月中美談判下一輪截止日期尚有時日,9 月-10 月可能是流動性寬鬆交易的窗口期,為中外股票、黃金、美債等大類資產提供相對有利的宏觀環境,預期中外股票不會持續橫盤震盪,而是繼續上漲。9 月恒指上漲 5%,滬深上漲 3%,創業板上漲 9%,恆科上漲 10%,黃金上漲 10%,驗證了判斷。
圖表 8:9 月全球大類資產迎來普漲
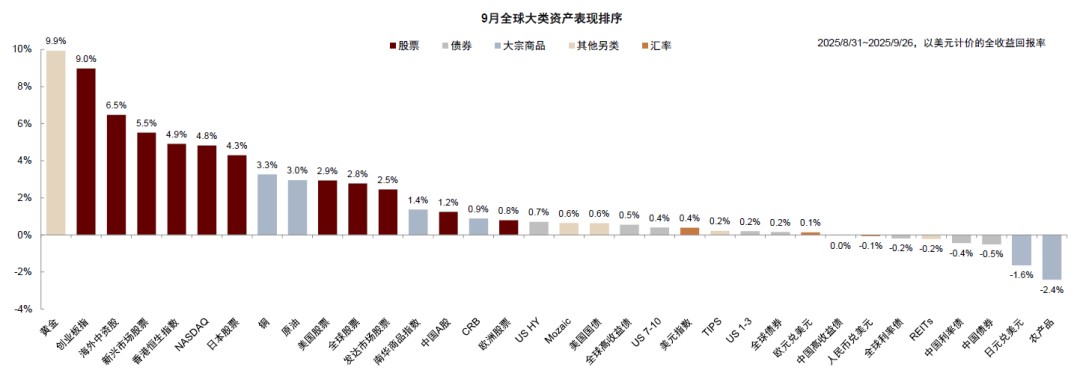
資料來源:Wind,Bloomberg,中金公司研究部
往前看,10 月可能仍為流動性共振的窗口期,寬鬆交易是市場主線,但同時也需更為關注行情持續性與市場波動風險:如果沒有增量政策,我國政府債券發行節奏可能開始放緩,帶動 M2 與社融增速迎來下行拐點。
圖表 9:本年度財政靠前發力,中國政府債券發行節奏較快
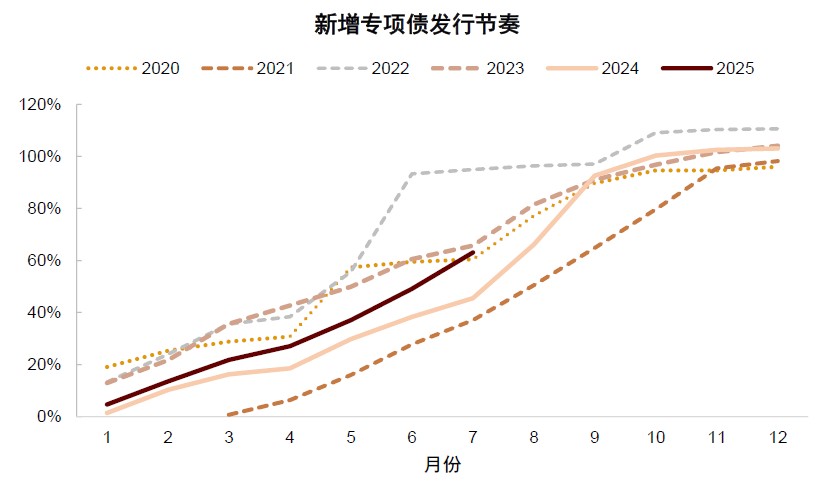
資料來源:Wind,中金公司研究部
宏觀流動性轉為收緊,假以時日可能影響市場流動性與風險偏好。在流動性驅動的市場中,股票等風險資產已經有一輪明顯上漲,資產波動率也可能有所上升,風險與機會並存。再看海外市場,領先指標顯示美國通脹存在上行壓力,如果通脹上行節奏快於預期,導致美聯儲降息週期提前從第一階段切換入第二階段,則對寬鬆環境不利,也可能導致市場波動。
資產配置建議:10 月繼續超配 A 股港股黃金,看好創業板與恆科,標配中美債券與美股,根據政策與流動性變化靈活調整倉位
預期 9 月-10 月中美流動性環境延續共振,美元處於下行週期,對各類資產 (股票、債券、黃金、商品) 形成利好。與 9 月市場行情類似,10 月可能仍是宏觀相對順風期,建議維持相對較高的風險偏好,超配中國股票。目前滬深 300 指數動態市盈率接近歷史均值,估值與此前牛市高點比還有擴張空間。
圖表 10:滬深 300 市盈率低於歷次牛市高點
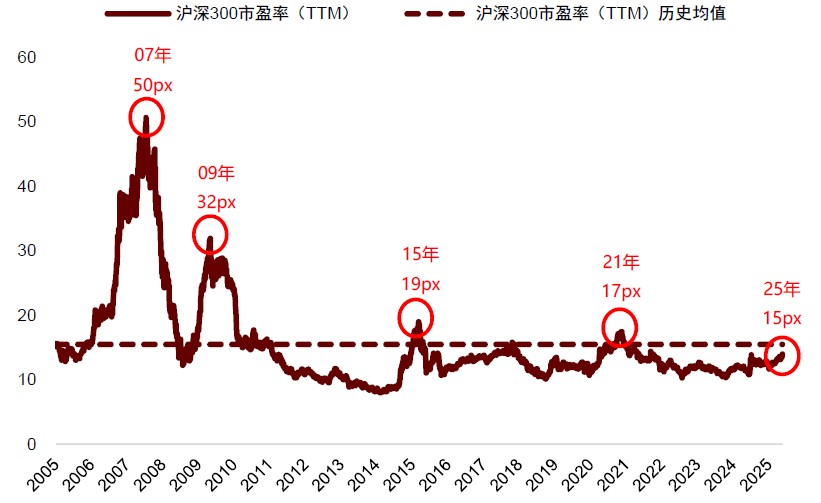
資料來源:Wind,中金公司研究部
從資金面看,居民存款搬家,個人投資者還在進場過程之中,主動性外資仍對中國股票配置不足,賺錢效應可能與資金流入繼續正向循環,支持中國股票表現。由於此前股市已經漲幅不小,且經濟基本面尚待改善,股票波動可能有所增大,更看好估值分位數相對較低且科技含量相對較高的創業板與恒生科技。在美聯儲較快降息階段,維持標配美股。歷史上的美元下行週期中,美股在計入美元匯率損失後往往跑輸非美市場,今年美國股票跑輸中國股票,符合美元下行期的歷史規律。從估值角度看,美股相對美債和非美股市估值仍然偏貴,標普 500 指數股權風險溢價接近 0%,反映投資者或對美國經濟與科技革命前景過於樂觀。
圖表 11:美股相對美債和非美股市估值仍然偏貴
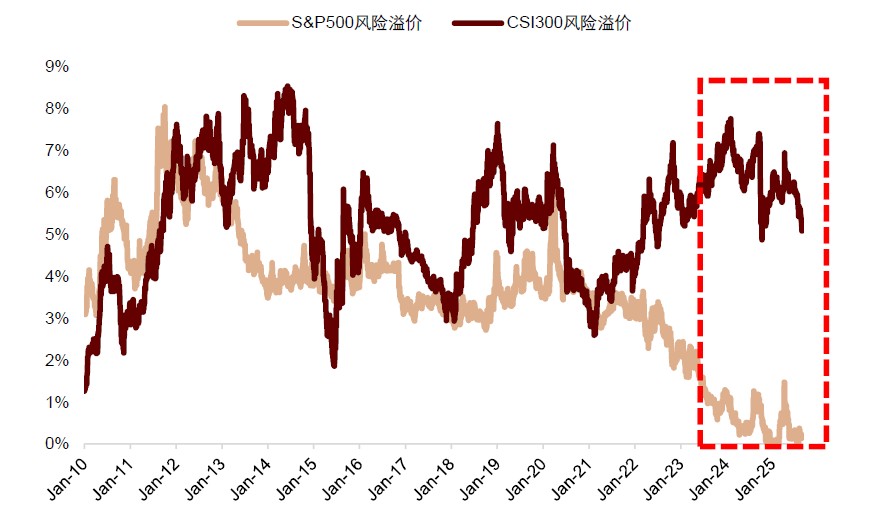
資料來源:Bloomberg,中金公司研究部
同時美股波動率過低,與利率環境不匹配,可能形成潛在風險。
圖表 12:美股 VIX 相對期限利差被嚴重低估
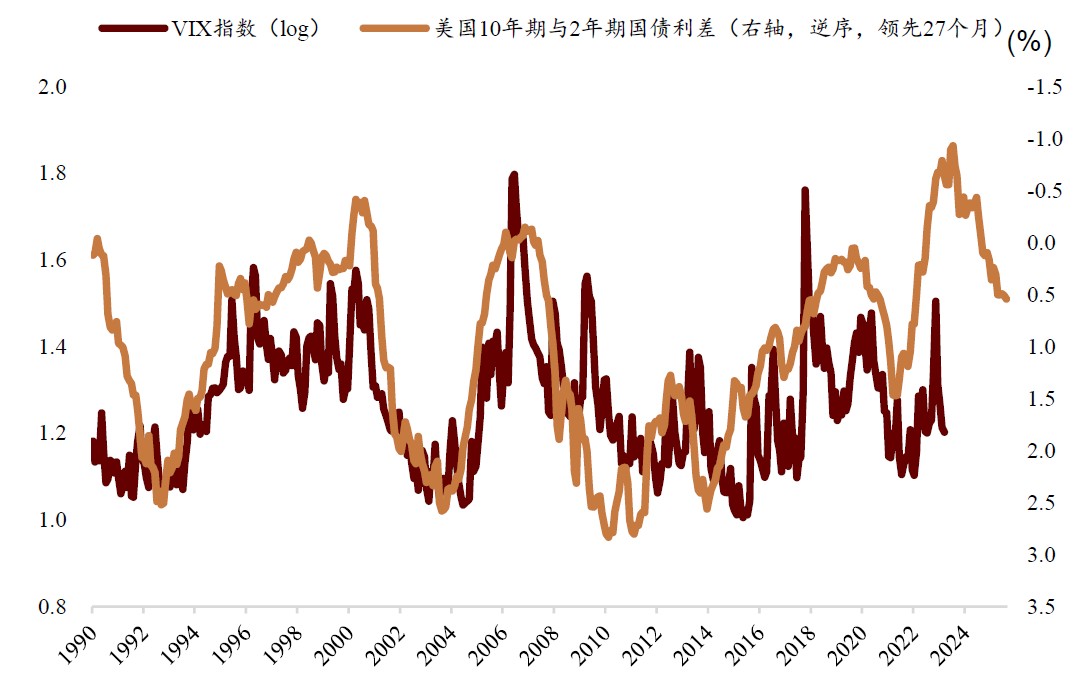
資料來源:Bloomberg,中金公司研究部
因此綜合風險收益,A 股和港股相對美股的配置性價比更高。由於宏觀流動性趨於寬鬆,且美聯儲獨立性與美元信譽受損,維持超配黃金。黃金年初以來上漲幅度較快,已經超出與基本面相匹配的水平,近期再度快速上漲,短期回調風險有所上升,建議淡化黃金交易價值,關注長期配置價值,逢低增配。
圖表 13:與歷史黃金牛市行情的上漲幅度與持續時間相比,當前黃金行情可能演繹仍不充分,現在或仍處於黃金牛市的初期階段
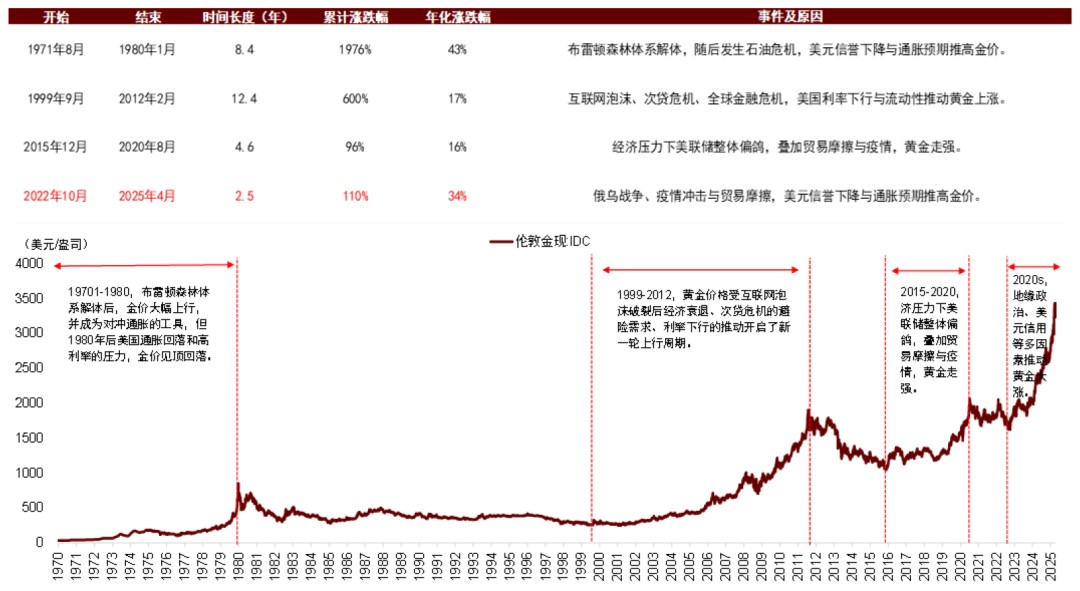
資料來源:Wind,中金公司研究部
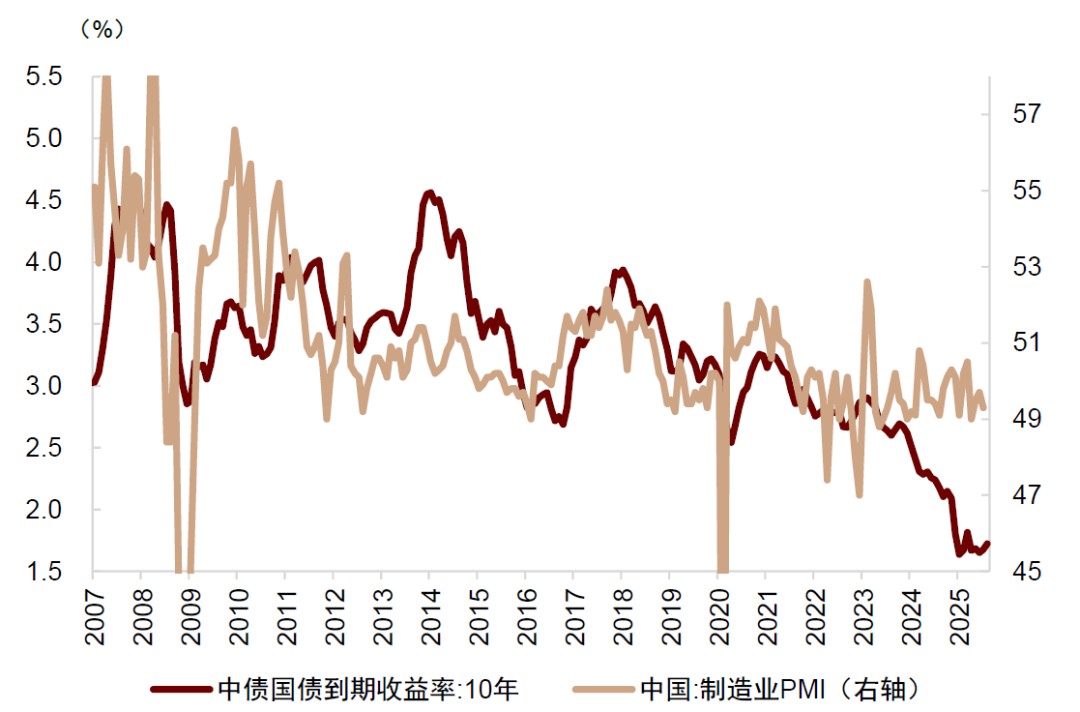
中國利率過去兩年相對經濟基本面下行過快,估值仍然偏貴,且風險偏好提升時 “股債蹺蹺板” 效應明顯,利率或面臨階段性上行壓力,向經濟基本面收斂。但在信用週期下半場,增長與通脹中樞下移,利率中樞可能也難以明顯抬升。綜合考慮多空因素,建議標配中國債券。
圖表 14:過去兩年債券利率下行速度相對經濟基本面過快
資料來源:Haver,Budget Lab,中金公司研究部
圖表 15:增長下行與貨幣寬鬆導致利率持續回落,信用週期拐點後 5 年下行幅度中位數達到 255bp
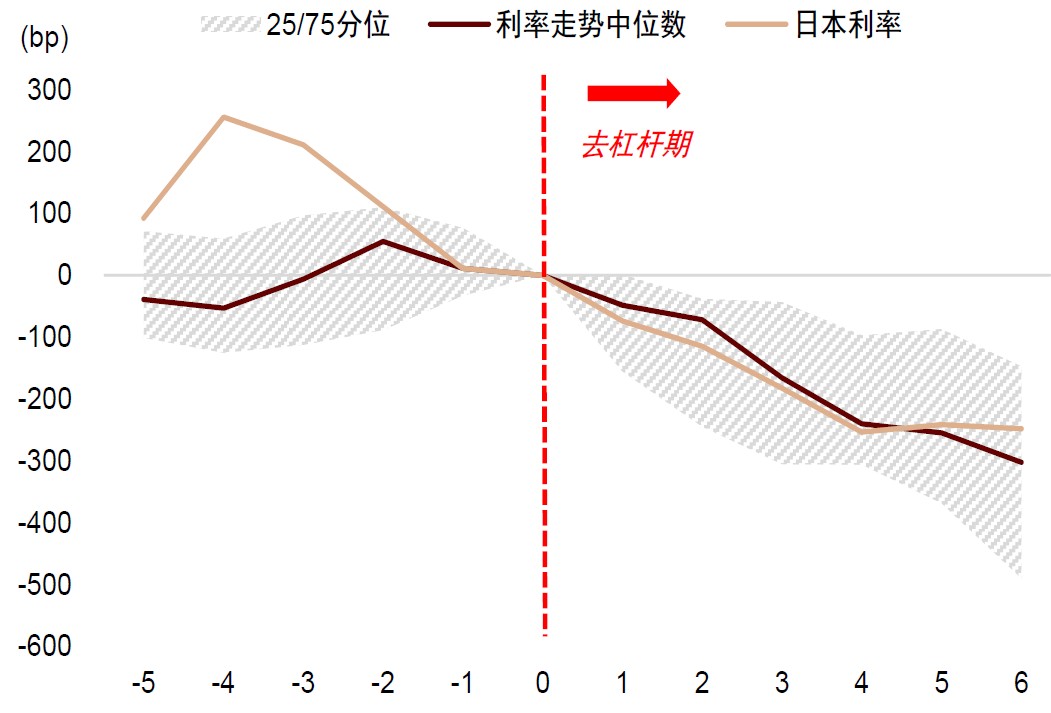
* 橫軸為信用週期拐點前後的第 X 年 資料來源:Wind,中金公司研究部
雖然今年美債供給壓力較小,不排除十年期美債利率降至 4% 以下的可能性,但通脹風險與美債發行壓力或在 1-2 個季度之後逐漸上升,增加市場不確定性,維持標配美債。上述配置建議的基準假設是流動性維持寬鬆,但根據前文分析,流動性窗口的持續性取決於政策路徑。也建議投資者密切關注 10 月-11 月期間的中美政策變化,做好倉位管理,如果流動性窗口發生變化,則適時調整資產配置。
