
谁在主导这轮黄金新高?沪金溢价由正转负,西方 ETF 资金主导

Participants in the gold market are divided into two categories: financial and non-financial. Although financial demand accounts for a small proportion, it is highly volatile and dominates price trends; non-financial demand accounts for a larger proportion and mainly provides support. ETF inflows have re-dominated, focusing on the interest rate cut path. COMEX futures positions are disconnected from gold prices, and the Shanghai gold premium has turned negative, indicating a cooling of investment in non-US regions. Overall, the demand structure of the gold market is complex, with diverse motivations among participants
Core Viewpoint
The structure of gold surface inventory shows that while the proportion of financial demand is small, it is highly volatile and dominates the trend changes in gold prices. Although non-financial demand accounts for a larger share, it mainly supports rather than determines the trend of gold prices.
To capture the trend fluctuations of gold prices, we provide three high-frequency tracking dimensions to portray a complete profile of gold investors, thereby comprehensively tracking the capital flow of gold financial demand since August.
Tracking Dimension One: ETF Regional Structure Breakdown. The Western market has regained dominance in ETF inflows, directly reflecting the macro pricing mainline of gold, which has shifted from the narrative of "de-dollarization" to a focus on interest rate cut paths.
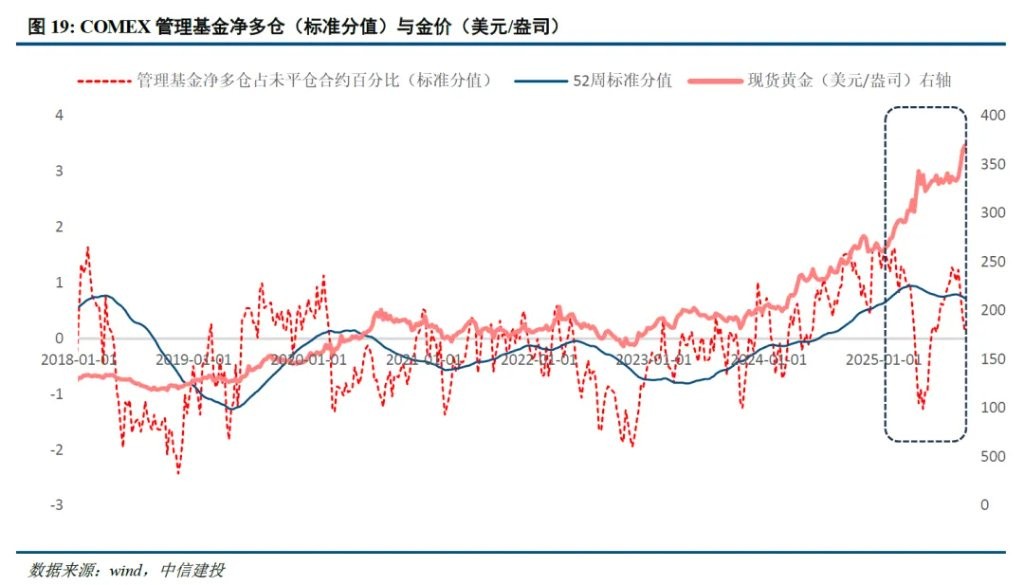
Tracking Dimension Two: COMEX Gold Futures Positions. Currently, there is a certain disconnection between the positions of "quick money" funds in COMEX and gold prices.
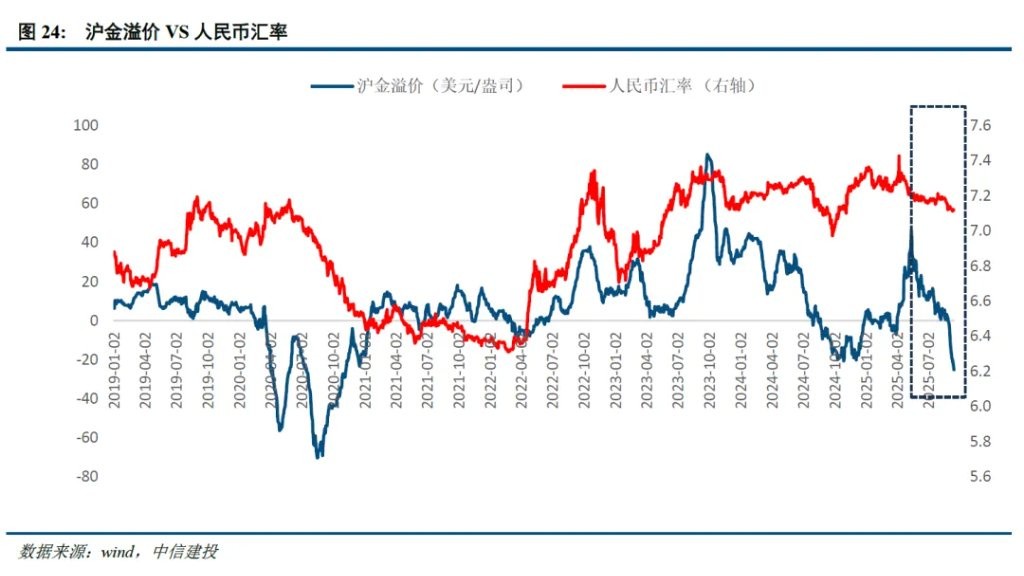
Tracking Dimension Three: Regional Price Spread Changes. The Shanghai gold premium has turned negative, while the New York premium has returned to a normal state. The former indicates a cooling of investment in non-US regions, while the latter supports the argument that "hot money" in futures may still be in a wait-and-see situation.
Summary
Participants in the gold market are widely distributed across different demand sectors, including gold jewelry and technology gold, central bank purchases, financial investments, and retail gold bar and coin investments. The motivations of these market participants are much broader than those explained by a single indicator or theory.
The structure of gold surface inventory shows that while the proportion of financial demand is relatively small, it is highly volatile and dominates the trend changes in gold prices. Although non-financial demand accounts for a larger share, it mainly supports rather than determines the trend of gold prices.
To capture the trend fluctuations of gold prices, we attempt to portray a complete profile of gold investors, thereby comprehensively tracking the capital flow of gold financial demand since August.
I. Gold Market Participants are Divided into Two Main Categories
The market demand structure and participants for gold present a clear context, with the three main demands primarily contributed by two categories of market participants.
The existing demand for gold can be roughly divided into three main types: private sector consumption demand, private sector investment demand, and official gold purchase demand.
The three major demand sectors for gold point to the diversity and complexity of gold pricing.
Based on the market demand structure for gold, market participants can be divided into two main categories: one is financial investment participants, and the other is non-financial investment participants. The former dominates the trend of gold prices, while the latter provides support at the market bottom.
Specifically, we can attribute most of the accumulation of gold inventory (including personal holdings of jewelry gold, gold investments used by households for long-term reserves, etc.) to low-volatility economic factors. In contrast, financial instruments (ETFs, net long positions in futures) and central bank purchases of gold are attributed to high-volatility financial factors.
Data shows that since 2000, the volatility of financial instruments accumulating gold (gold ETFs + net long positions in futures) is more than twice that of net consumption (jewelry + technology gold), but its accumulation speed is far lower than that of the latter.
Market participants in financial market investments mainly include the gold ETF market, global central banks, and non-commercial long positions in futures. These three have high volatility elasticity and dominate the trend of price evolution. First, the fundamental factors dominating the gold ETF market are opportunity costs (policy interest rates).
Second, the investment demand from official sectors has significantly increased in the demand structure over the past two years, becoming a key driving factor for gold demand.
Third, the non-commercial long positions in COMEX futures can be seen as "hot money" in the gold financial investment market, which to some extent also participates in the process of gold price discovery.
Non-financial market participants mainly contribute to private sector consumption demand (jewelry, technology gold) and demand for gold coins and bars (households for long-term reserves). Non-financial market participants are more inclined to buy low and hold long-term, and the fluctuations in capital flow are usually limited. Therefore, although this part of market participants does not determine the trend of gold prices, they provide bottom support for the market.
First, private sector consumption demand dominated by gold jewelry is the largest demand segment for gold, accounting for nearly 60% of total demand.
Second, traditional physical gold investment (long-term holding by households) accounts for nearly 30% of total gold demand and is closely related to household wealth accumulation.
II. The funding drive behind the new high in gold prices is still financial investment participants
Since the end of August, gold has broken the oscillation pattern that followed May this year and has shown a trend of upward movement. We can roughly judge that the funding drive behind this round of price highs is still financial investment participants (ETF market) by analyzing the changes in the three major demands.
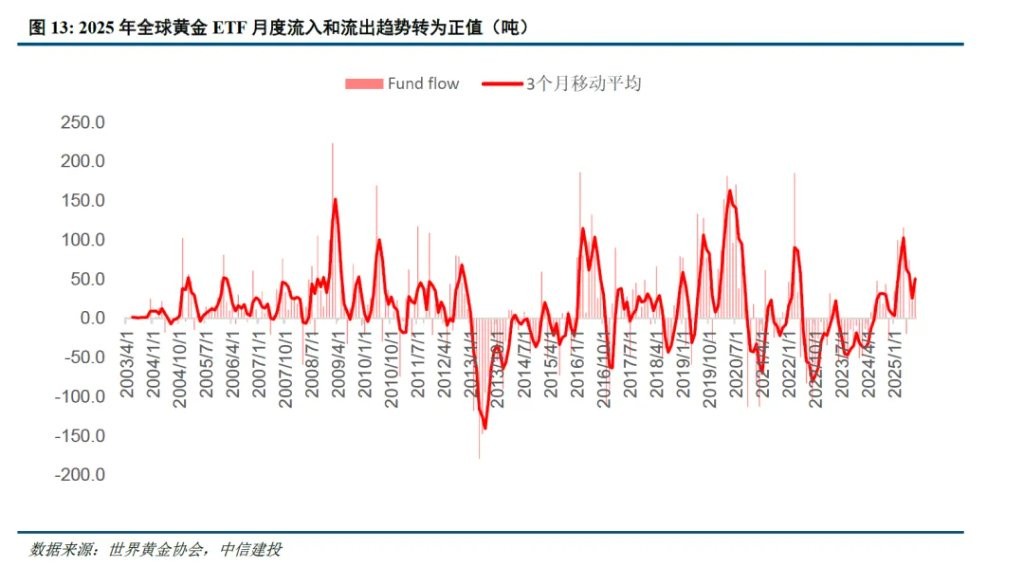
First, the inflow of funds into financial instruments (ETFs) has warmed up.
Looking back at gold investment demand in H1 2025, the investment demand in the second quarter showed marginal slowdown, which may be the main reason for the price adjustment after May. Entering H2, after a single-month outflow of gold ETF investment in May, there have been three consecutive months of inflows from June to August, with total holdings continuously rebounding, still 6% lower than the peak at the end of the month in Q4 2020.
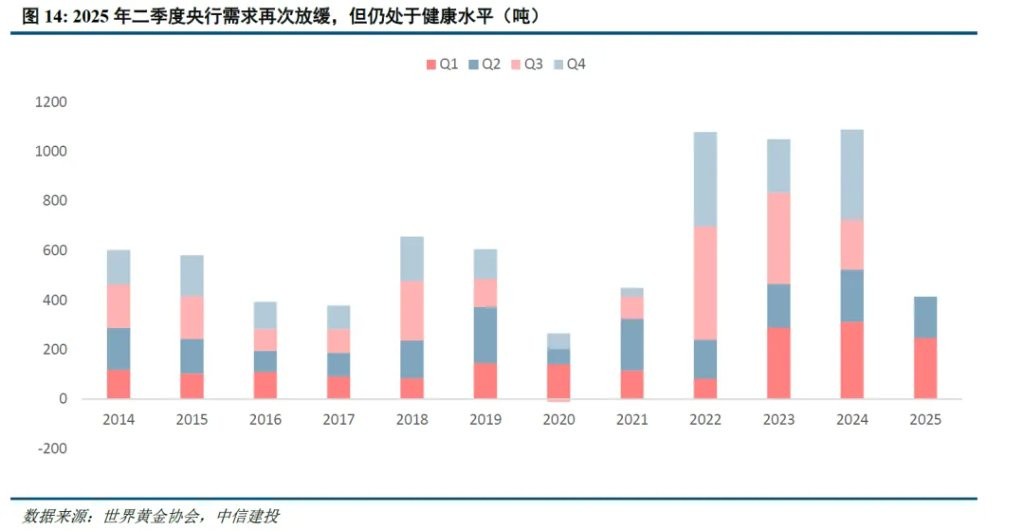
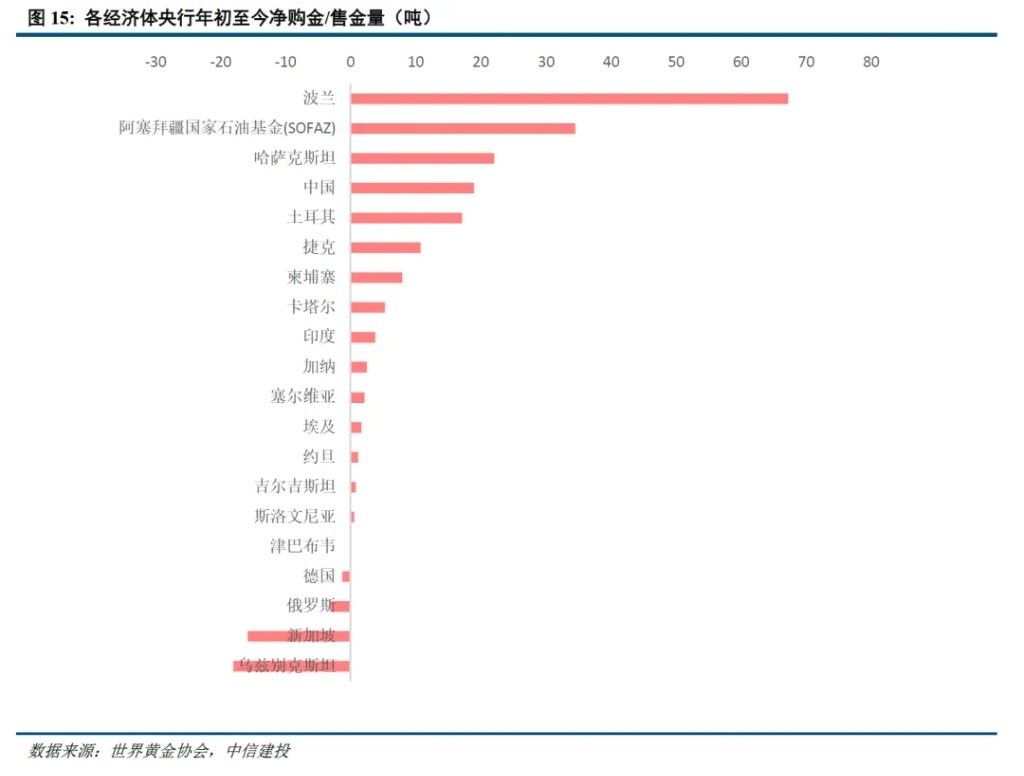
Second, the pace of central bank gold purchases has slowed but remains steady.
Central banks of various economies are still an important pillar of gold demand in 2025, but the pace of gold purchases has slowed. In the second quarter, the gold purchase demand from central banks of various economies remained at a healthy level, reaching 166 tons, but a 33% quarter-on-quarter decline compared to the previous quarter marked the second consecutive quarter of slowing central bank gold purchases.
Third, structural differentiation in non-financial investment demand.
As gold prices hit historical highs, gold jewelry consumption has fallen to levels close to those during the pandemic. In the second quarter, global gold jewelry consumption recorded a double-digit decline, dropping to 341 tons, the lowest level since Q3 2020. The demand in the second quarter was 30% lower than the five-year quarterly average of 487 tons.
Meanwhile, the demand for physical gold remained robust in H1 2025, with physical gold (coins, bars) investment reaching the highest record since 2013 in the first half of 2025.
III. Three high-frequency tracking dimensions of gold investor profiles
To comprehensively portray the investor profile behind the new high in gold prices, we further provide three high-frequency tracking dimensions.
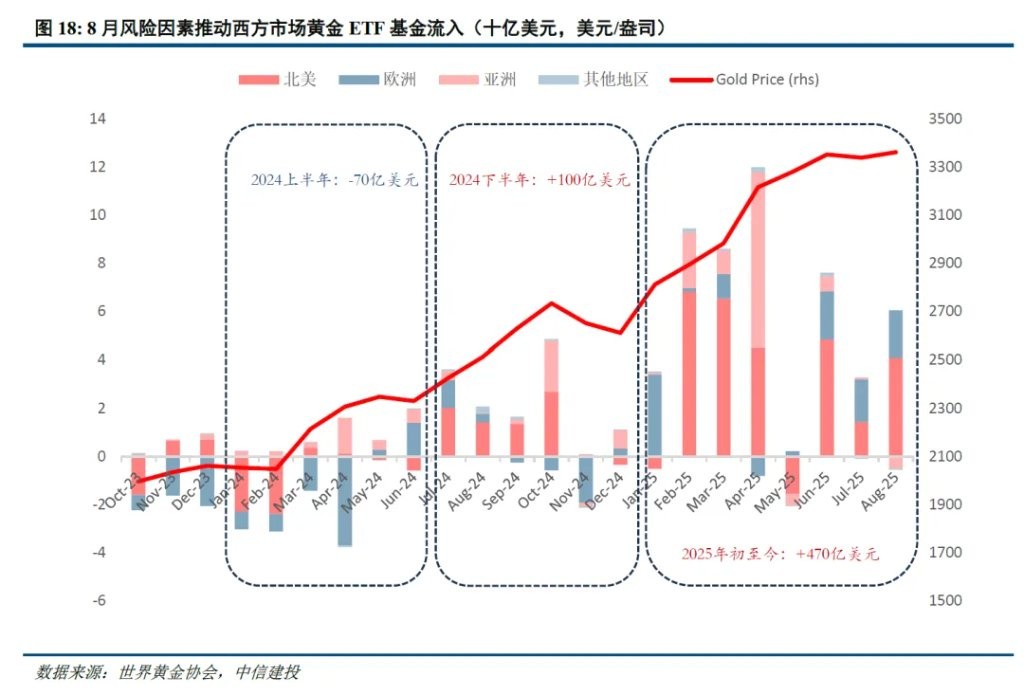
Tracking Dimension One: ETF regional structure breakdown. Since the second half of 2024, global ETF demand has entered a replenishment phase, but the dominant buying power has switched multiple times, reflecting changes in the market pricing narrative. From June to August this year, Western markets have once again dominated ETF inflows, directly mirroring the macro pricing narrative for gold in the second half of the year, which has shifted from the previous "de-dollarization" narrative to a focus on interest rate cut paths.
Tracking Dimension Two: COMEX Gold Futures Positions.
Reviewing the movements of "fast money" funds in COMEX during this round of gold price increases, it can be observed that there is a certain disconnection between gold prices and positions. Net long positions of managed funds typically represent the positions of hedge funds and large financial institutions. Currently, these positions are above historical averages, but considering the current gold price levels, they appear slightly low.
Tracking Dimension Three: The formation mechanism and changes of regional price differentials.
Tracking two key regional price differentials at this stage can more clearly capture the second wave of gold price increases that started in August and the first wave of price increases that peaked in April, reflecting changes in market investment structure.
Firstly, the Shanghai gold premium has turned negative, indicating a cooling of investment enthusiasm in non-US regions, while Western regions have re-dominated the inflow of global gold investment funds.
Secondly, the premiums of New York gold and London gold have returned to normal levels. After the previous cross-market arbitrage that boosted market activity has cooled, during this round of price increases, "hot money" in futures may still be in a wait-and-see situation.
Main Text
Only the core points and charts of the main text are displayed.
Authors: Zhou Junzhi, Chen Yi, Source: CSC Research Macro Team, Original Title: "Investor Profile of Gold | JianTou Macro · Zhou Junzhi Team" Risk Warning and Disclaimer
The market has risks, and investment requires caution. This article does not constitute personal investment advice and does not take into account the individual user's specific investment objectives, financial situation, or needs. Users should consider whether any opinions, views, or conclusions in this article are suitable for their specific circumstances. Investment based on this is at one's own risk
