
U.S. stock "bubble alarm" sounds! Three major trends indicate a repeat of the 1999 carnival eve

The US stock market is facing bubble alarms, with analysts warning that the current economic and market conditions are similar to those before the 1999 internet bubble. Despite adverse signs in the employment and real estate markets, major stock indices continue to rise, driven by massive fiscal deficits and investments in artificial intelligence. The valuation of the S&P 500 Information Technology sector has reached historical highs, with the Shiller price-to-earnings ratio nearing 40, indicating irrational exuberance in the market. Investors are concerned about the returns from artificial intelligence, and the market is significantly overbought
According to Zhitong Finance APP, despite increasing signs of trouble in the employment and real estate markets, major U.S. stock indices continue to rise. Overall economic growth still appears strong. However, analysts warn that a crisis comparable to the internet bubble is quietly brewing.
The U.S. economy and stock market are being driven by massive and unsustainable fiscal deficit spending, as well as an explosive growth in artificial intelligence spending.
Individuals, including billionaire fund manager David Einhorn, are beginning to worry whether the huge investments in artificial intelligence will yield returns. A recent study published in the Harvard Business Review questioned whether artificial intelligence can truly enhance productivity.
In the view of Seeking Alpha contributor Bret Jensen, the current economic/market situation increasingly resembles that of 1999, the period just before the internet bubble burst in early 2000.
Jensen emphasizes that three key trends in the current market/economy are strikingly similar to the late stages of the internet boom in 1999.
1. Valuations have become "crazy"
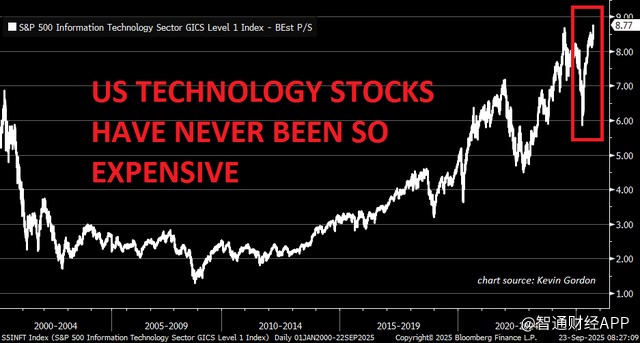
High valuations may be the most obvious similarity between the two periods. The expected price-to-sales ratio for the S&P 500 Information Technology sector has reached 8.8 times. This is far above the levels seen at the end of the internet boom and is the highest level ever recorded.
Expected price-to-sales ratio for the S&P 500 Information Technology sector
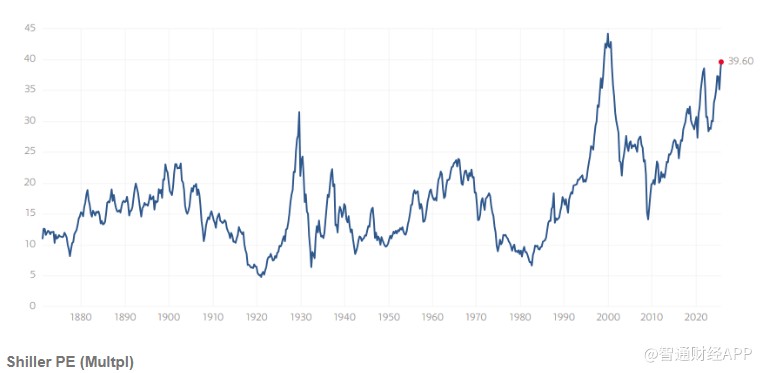
The Shiller price-to-earnings ratio is close to 40, a level that has only been seen twice in history and is currently slightly below the level reached in 1999. The "Shiller price-to-earnings ratio," or cyclically adjusted price-to-earnings ratio (CAPE), calculates the price-to-earnings ratio using a 10-year average of earnings after removing the effects of inflation, smoothing out the impact of economic cycles on valuations. Historical data shows that when the CAPE of U.S. stocks exceeds 25 times, it enters a period of "irrational exuberance."
Shiller price-to-earnings ratio close to 40
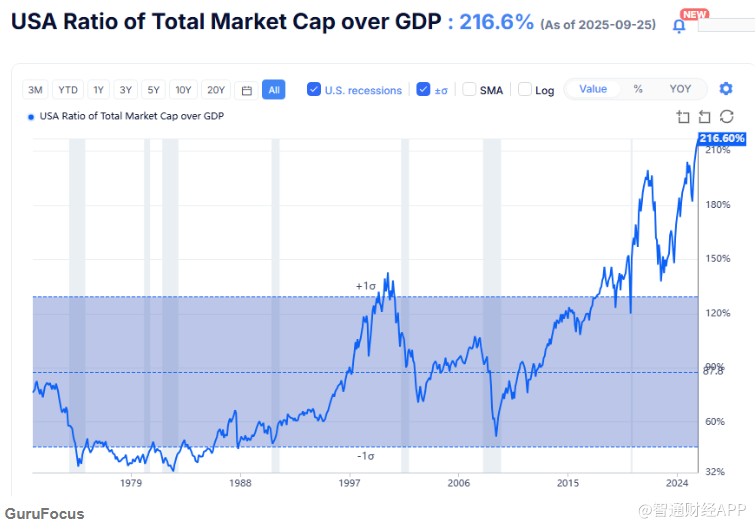
Additionally, the ratio of stock market capitalization to GDP has reached historical highs, a ratio also known as the "Buffett Indicator," which measures the overall market's overbought condition.
Buffett Indicator reaches record high
2. The return of "vendor financing"
Older investors may remember that "vendor financing" once surged. In this model, vendors like Cisco (CSCO.US) would provide financing services to customers purchasing their equipment on favorable terms at the time of sale NVIDIA (NVDA.US) announced last week that it will invest up to $100 billion in OpenAI, helping the ChatGPT parent company to build data centers equipped with NVIDIA chips on a large scale.
Wall Street analysts have mixed views on this deal. Bulls believe it further demonstrates the booming growth of artificial intelligence infrastructure business, while bears argue that it is merely NVIDIA assisting a cash-strapped client.
Some individuals also suggest that this "investment" seems to be a disguised form of supplier financing.
3. Market Performance Divergence
At the end of 1999, Microsoft (MSFT.US) was the most valuable stock in the entire stock market, with a market capitalization of about $600 billion. This was impressive, but this figure only accounted for about one-third of France's annual GDP at the time.
Just like now, there was a clear polarization in the market at the end of the internet boom, with the top ten stocks by market capitalization accounting for about 40% of the total market value. The only company that was in the top ten 25 years ago was Microsoft.
However, today NVIDIA's market capitalization is slightly above $4.3 trillion, far exceeding the annual GDP of the UK ($3.6 trillion) and France (slightly below $3.2 trillion). Microsoft and Apple (AAPL.US) also have market capitalizations close to $4.3 trillion. Alphabet (GOOG.US, GOOGL.US) has a market capitalization of $3 trillion.
So, will this time be different?
Jensen from Seeking Alpha states that factors such as FOMO (fear of missing out), momentum, algorithmic trading programs, and passive index investing can keep the stock market elevated even after deviating from reasonable valuations. However, over time, high valuations are difficult to sustain. For investors, this situation will not be different this time
