
European Natural Resources Fund: The Federal Reserve's interest rate cut indicators for 2026 and 2027 are "unreliable," and the market mainstream has not reflected a drop in U.S. interest rates to 1%

Li Gangfeng, an analyst at the European Natural Resources Fund, pointed out that the Federal Reserve's interest rate cut indicators for 2026 and 2027 are unreliable, and the market has not reflected a drop in U.S. interest rates to 1%. Currently, indicators that the gold bull market has ended include the return of the U.S. interest rate hike cycle and accelerated global economic cooperation. Despite the impending interest rate cut cycle, futures funds are increasing short positions, limiting the rise in metal prices. As of September 16, the price of gold in U.S. dollars has accumulated an increase of 40.5%, and the price of silver has risen by 47.2%
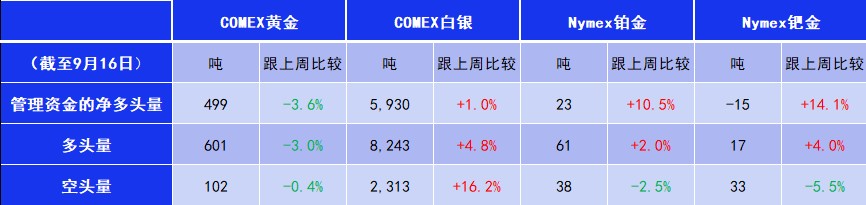
According to LSEG news, Zhitong Finance APP learned that Li Gangfeng, a special analyst for the European Natural Resources Fund Commodity Discovery, analyzed CFTC data and pointed out that as of last Tuesday, except for U.S. gold futures, the net long positions of U.S. metal futures funds have all rebounded, while the net long in gold has unexpectedly declined. As the new round of interest rate cuts in the U.S. is about to begin, theoretically, any funds should be going long on commodities (especially monetary metals) now, but futures funds surprisingly started to gradually increase their short positions three weeks ago — this may also explain why the recent rise in metal prices has been limited.
Data Source: CFTC/LSEG Workspace
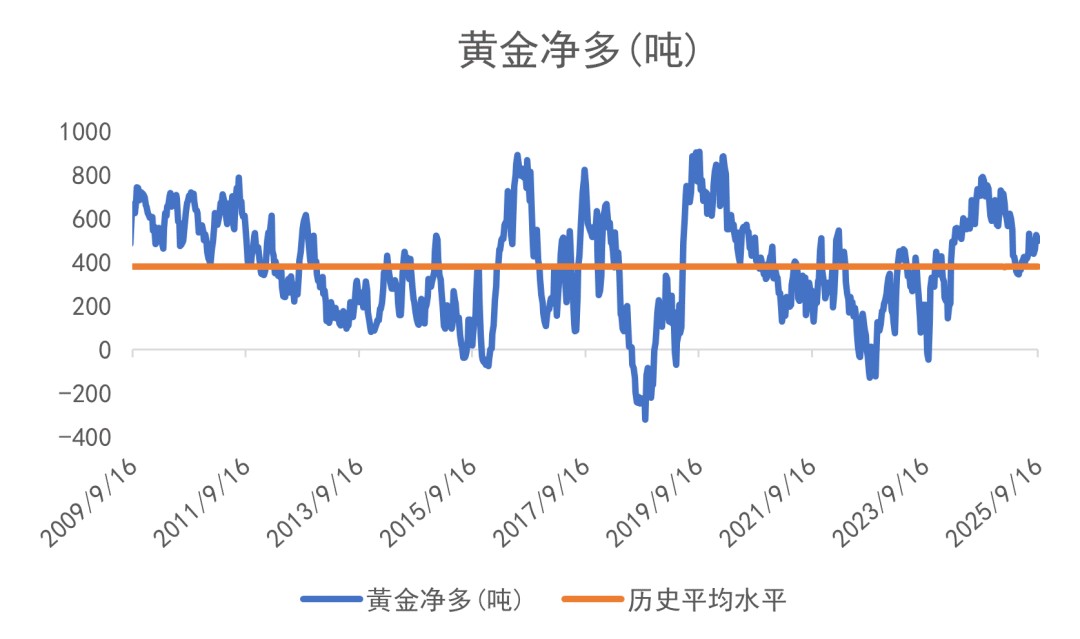
The long positions of U.S. gold funds fell by 3% week-on-week; short positions fell by 0.4% at the same time, resulting in net long positions dropping from 518 tons to 499 tons, marking the 102nd consecutive week of net longs (previously there were 46 consecutive weeks of net longs), which is also 55% of the historical peak of 908 tons in September 2019. As of September 16 this year, the dollar gold price has accumulated a 40.5% increase this year (last week +38.1%), while the long positions of funds have decreased by 1.4% during the same period (last week +1.7%).
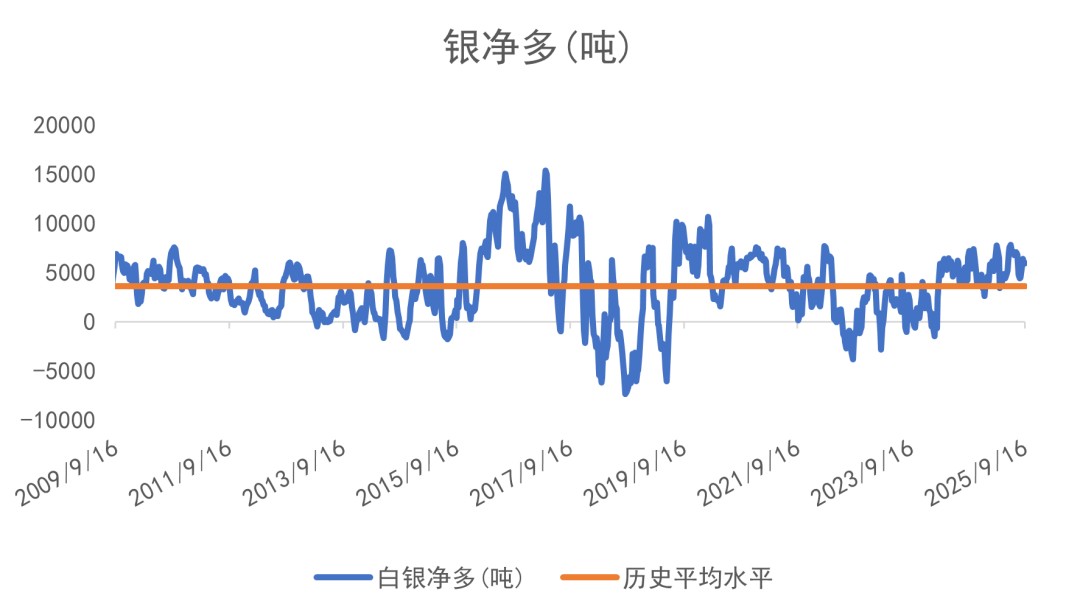
Silver, which has a high correlation with gold prices, has always been more volatile than its rich cousin. The long positions of U.S. silver rose by 5% week-on-week; short positions increased by 16%, resulting in net long positions rising from 5,874 tons to 5,930 tons, marking the 82nd consecutive week of net longs, also 39% of its peak period. As of September 16 this year, the dollar silver price has accumulated a 47.2% increase this year, while the long positions of silver funds have accumulated a 40.4% increase (last week +34.0%), and short positions have accumulated a 28.9% decrease (last week -38.8%).
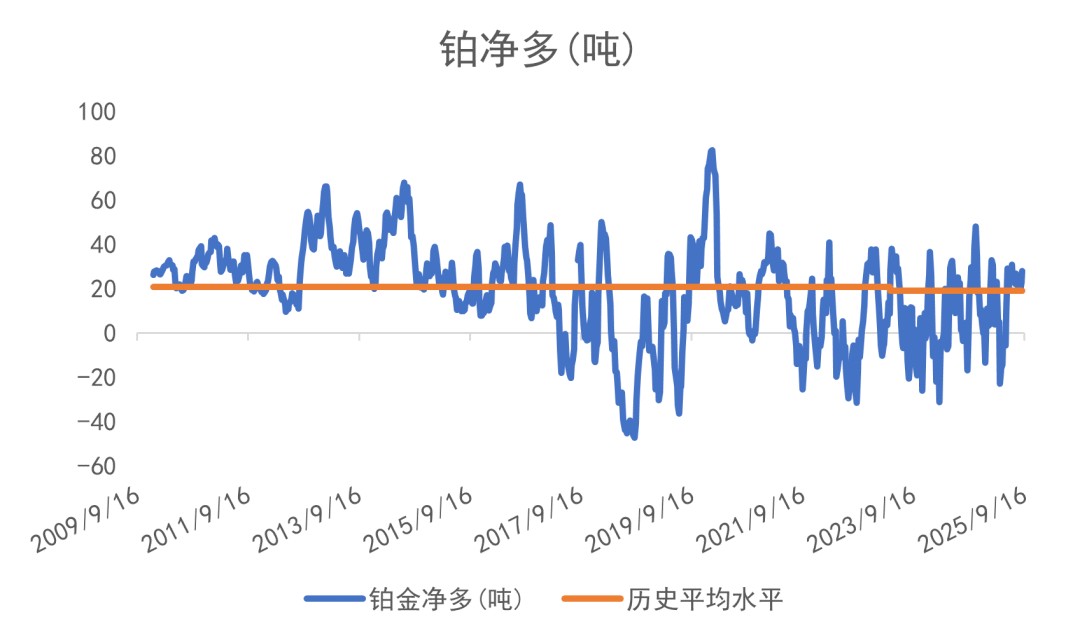
The long positions of U.S. platinum funds rose by 2% week-on-week; short positions fell by 2.5%, resulting in net long positions rising from 21 tons to 23 tons last week. Historically, U.S. platinum funds have maintained net short positions for the longest time at 31 weeks (from April 2018 to October 2018).
U.S. palladium funds have returned to a net short position of 15 tons. Li Gangfeng believes that even though the bull market for palladium has ended, as long as palladium maintains a significant net short position, it may still be relatively difficult for other precious metals to completely turn around. U.S. palladium fund positions have been in net short territory for 140 consecutive weeks, marking the longest net short period in history.
The net long positions of funds in U.S. futures gold have dropped by 12% from the beginning of the year (accumulated increase of 35% in 2024)
 Data Source: CFTC/LSEG Workspace
The net long position of funds in U.S. futures silver has increased by 127% year-to-date (2024 cumulative decline of 1%)
Data Source: CFTC/LSEG Workspace
The net long position of funds in U.S. futures platinum has turned positive year-to-date (2024 cumulative decline of 152%)
Data Source: CFTC/LSEG Workspace
The net long position of funds in U.S. futures copper has turned positive year-to-date (2024 cumulative decline of 132%)
Data Source: CFTC/LSEG Workspace
In the past, funds controlled metal prices through the futures market. For example, since the pandemic spread globally in 2020, the net long position of precious metals in U.S. futures has continuously declined, reflecting that funds intentionally prevented precious metals from rising. However, starting in the first quarter of this year, futures funds began to close long positions for profit, but gold prices remained high, indicating that physical demand far exceeds the leverage in the futures market.
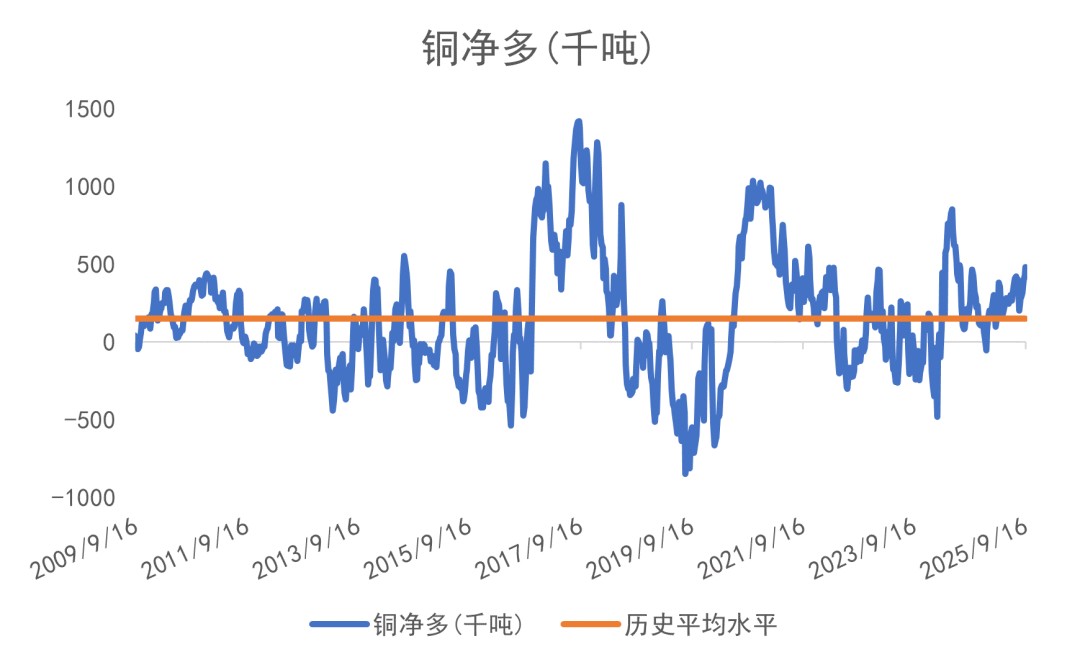
The CFTC weekly report on U.S. copper has been published since 2007. Due to the bear market in copper from 2008 to 2016, it is not surprising that U.S. futures copper has historically been mostly at net short levels. However, since 2020, due to the global pandemic affecting supply and mining operations, coupled with market expectations of strong demand for copper from electric vehicles, copper prices have risen, even reaching new historical highs. Currently, the global investment sentiment is that the world is entering an economic recession, leading to reduced demand for commodities.
The fluctuations in copper prices this year can be said to be dictated by Trump—he first announced plans to impose a 50% tariff on imported copper to the U.S., which caused copper prices to surge; the final version, however, only imposed a 50% tariff on certain semi-finished copper products, resulting in a sharp drop in copper prices in a single day. Li Gangfeng believes that Trump's related stakeholders first went long on copper futures before announcing tariffs on imported copper, and then heavily shorted copper futures before the clear announcement of tariffs.
In addition to gold as a safe haven, crude oil (political risk) and materials monopolized by China (rare earths, antimony, tungsten, etc.) should theoretically see higher international prices (not domestic prices). Recently, the U.S. government not only invested in MP Materials but also signed a 10-year supply contract with them, agreeing to purchase neodymium and praseodymium at a floor price nearly double that of China's price (USD 110 per kilogram). Stock prices surged sharply due to news. Recently, there have been reports that the U.S. Department of Defense wants to acquire cobalt metals overseas.**
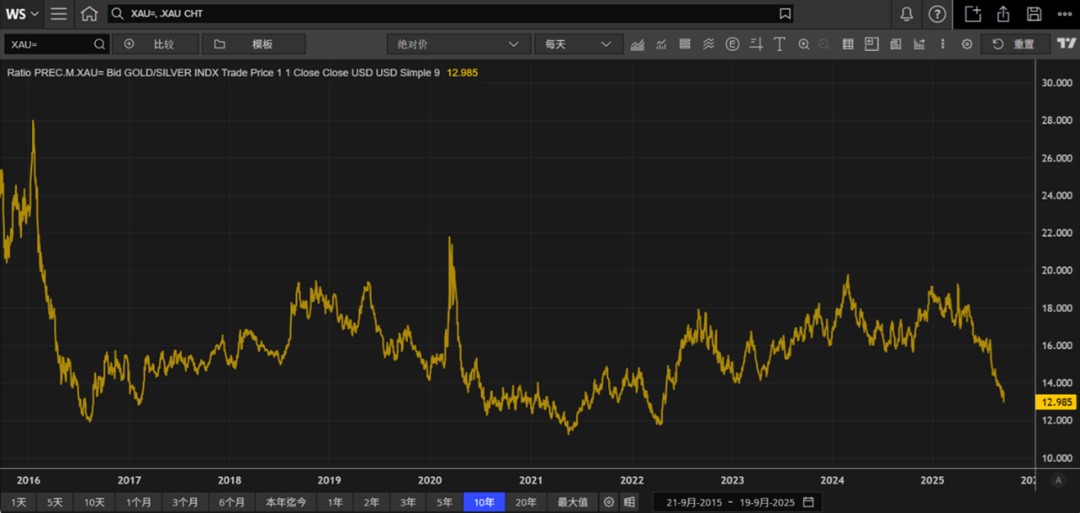
Last week, the ratio of gold prices in U.S. dollars to North American gold mining stocks experienced a sharp decline:
Data source: LSEG Workspace
As of Friday (the 19th), the gold price/North American gold mining stock ratio was 12.985X, down 2.7% from 13.343X on the 12th, and down 32.1% year-to-date, hitting the lowest point since the first half of 2022, indicating that North American gold mining stocks have underperformed physical gold this year. They have risen 16.5% year-to-date in 2024. The cumulative increase for the entire year of 2023 was 13.2% (2022: +6.4%), indicating that mining stocks have underperformed physical gold for at least three consecutive years, but this year gold mining stocks have regained some ground. Historically, before 2008, the ratio of gold prices in U.S. dollars to North American gold mining stock indices was only below 6 times.
In fact, since 2009/2010, the performance of mining stocks has consistently lagged behind the commodities themselves, and in recent years, even oil and natural gas production companies have shown similar trends. Li Gangfeng believes one reason for this is the growing emphasis on environmental, social responsibility, and corporate governance (ESG) in the investment community. For example, in 2021, Blackrock committed to the UK Parliament not to invest in coal and oil production companies, and they are certainly not the only fund company that has pledged to invest only in companies and industries that place greater importance on ESG.
Li Gangfeng believes that tracking the stock prices of overseas gold mining companies is a relatively reliable forward-looking tool; if gold prices continue to rise but gold mining stocks experience a sharp decline, caution is warranted.
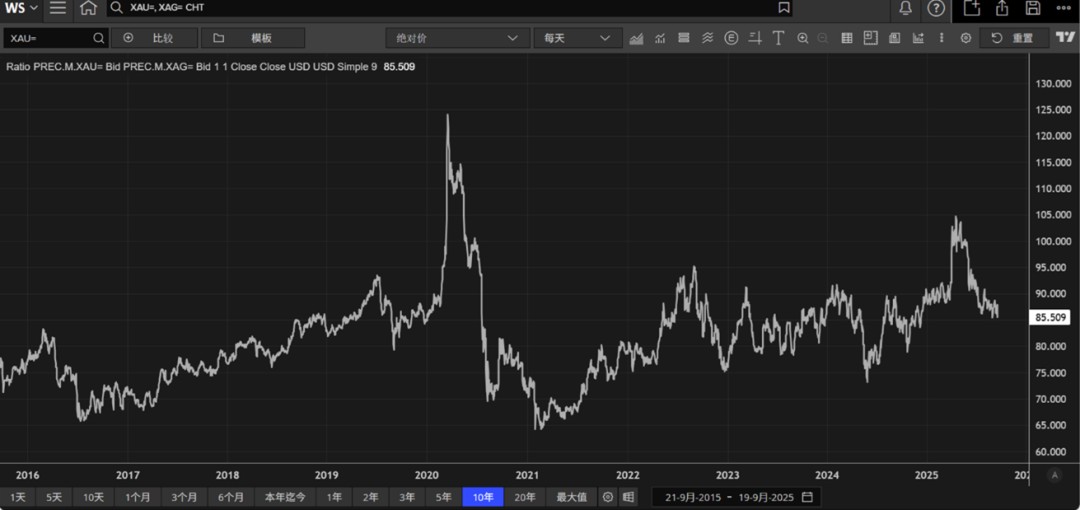
Gold-Silver Ratio
The gold-silver ratio is one of the indicators measuring market sentiment. Historically, the gold-silver ratio has operated at levels of approximately 16-125 times:
Data source: LSEG Workspace
Generally, the more panic in the market, the higher the gold-silver ratio. For example, in 2020, due to the global spread of COVID-19, the gold-silver ratio once surged past the historical high of 120 times.
Last Friday, the gold-silver ratio index was 85.509, down 1.0% week-on-week, with a cumulative decline of 5.9% this year and a cumulative increase of 13.0% in 2024. The cumulative increase for 2023 was 9.1%.
U.S. Rate Cut in October is a Done Deal
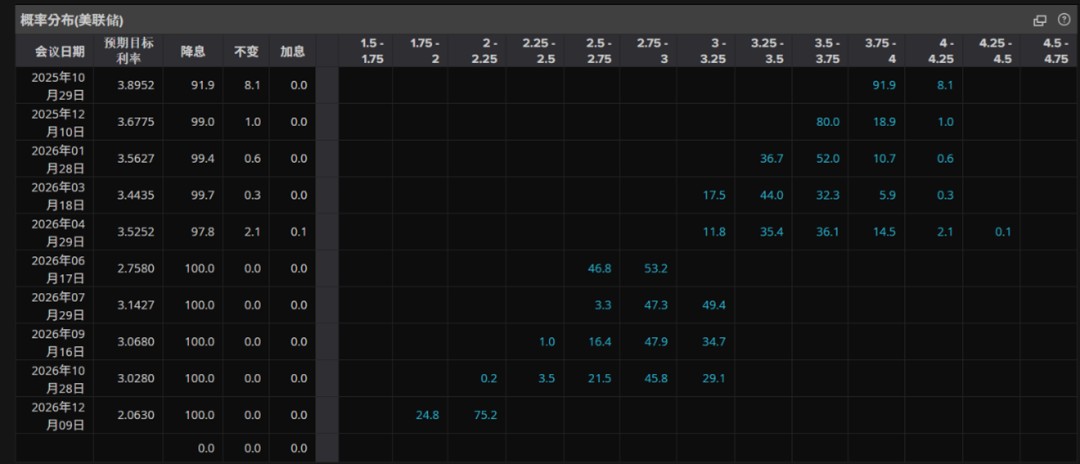 Image source: LSEG Workspace
Currently, the market believes that the probability of a 0.25% rate cut in October has risen from 85% to 91.9%, and the probability of a rate cut in December has also increased from 75% to 80%, estimating that there will be approximately three rate cuts this year. The market expects that by June next year, the U.S. interest rate may be about 1.5% to 2.5%-3.0% lower than it is now.
Last week, the Federal Reserve held a meeting, and in addition to the expected 0.25% cut, Powell also confirmed that there would be two more cuts this year; more importantly, the Federal Reserve (on average) currently believes that there will be one more cut in both 2026 and 2027, with the magnitude of the cuts generally less than predicted by investment banks.
Interestingly, if Powell is correct: the U.S. economic fundamentals remain good, and inflation levels are under control, then why is there a need for rate cuts in the next two years?
Even more interestingly, as is well known, Powell will step down in May next year, and Trump will certainly recommend one of his allies to be the Federal Reserve Chairman, while Trump has always stated that the Fed should cut rates to 1%—in other words, if the market believes the current Fed guidance for investment (the current mainstream market has not yet reflected a drop in U.S. rates to 1%), commodities, especially gold, still have room for appreciation.
In fact, looking at the trend of U.S. economic data (it is the direction rather than the actual numbers), stagflation is one of the possible scenarios. According to textbooks or AI, in the case of stagflation, one should invest in commodities, physical assets, and defensive stocks; conversely, bonds and growth stocks would be under pressure (it is possible that China's development could be the last straw that breaks the back of U.S. tech stocks).
In the past, a decline in U.S. interest rates did not necessarily benefit the dollar or gold prices, as market confidence was strong and funds chased growth stocks while ignoring safe-haven gold. But now, many financial giants have entered the market holding gold, currently, gold is clearly in a consolidation/slow bull phase within a bull market.
The main indicators for the end of the current gold bull market are twofold: the first is that the U.S. returns to a rate hike cycle for various reasons; the second is that the world (mainly China and the U.S.) turns swords into plowshares, with countries strengthening complementary cooperation, leading to accelerated global economic growth.
The biggest test in the next 12 to 24 months will be if the U.S. starts to cut rates, but inflationary pressures begin to rise again, where will the Federal Reserve go from there?
