
PPI's Signal for Bull Markets

This article explores the relationship between PPI and the Chinese stock market, pointing out that the peaks and troughs of PPI correspond to those of stock indices. In particular, a bottom in non-ferrous PPI signals the start of a bull market, while a peak in black PPI indicates the end of a bull market. Historical review shows that since September 24 of last year, the stock bull market has started and still has room for growth. The article summarizes four signal significances of PPI for the stock market, emphasizing the importance of the rebound in non-ferrous metal price cycles for the bull market, as well as the supporting role of the Federal Reserve's interest rate cuts and China's export resilience for the economy
Core Viewpoints
The market has never stopped discussing the correlation between PPI and stock bull markets, but there is a relative lack of a systematic observation framework.
Through a review of four historical bull and bear cycles in China, we summarize four signal significances of PPI for the Chinese stock market.
The peaks and troughs of the PPI total index basically correspond to the peaks and troughs of stock indices. Compared to this market consensus "weak signal," we pay more attention to the "strong signals" given by the PPI structure—when the non-ferrous PPI bottoms out, it indicates the start of a stock bull market, while when the black PPI peaks, it signifies the end of the bull market.
Based on the above signals, the current non-ferrous PPI has bottomed out, while the black PPI still has considerable room before peaking. This also means that a stock bull market has been definitively initiated since September 24 of last year, and the bull market has not yet ended, with greater market movements still to be expected.
Summary
How to understand the macro fundamental information conveyed by price signals, and how to interpret the continuation and switching of macro pricing clues after the PPI year-on-year bottoms out?
We systematically sort out the signal significance of PPI for stock bull markets through historical reviews and attempt to clarify the impact of the current PPI trend on stock market pricing.
Through a review of four historical bull and bear cycles in China, we summarize four signal significances of PPI for the Chinese stock market.
① The peaks and troughs of PPI year-on-year can depict the peaks and troughs of the stock market (with a lag), and a positive PPI can indicate a rebalancing of stock market styles.
② A bottoming out of the non-ferrous PPI can indicate the start of a stock bull market, and whether the rebound in non-ferrous metal prices can transmit to the overall PPI can capture signals of a comprehensive bull market.
③ The prices of black commodities are highly synchronized with the PPI cycle, which has strong signal significance for the transition from a stock bull to a bear market.
④ The sensitivity of different industries' profits to changes in PPI varies significantly, and the signaling meaning of the PPI index for industry profit bulls is slightly chaotic.
From a forward-looking signal perspective, the stabilization and rebound of non-ferrous metal price cycles still hold strong signal significance for the initiation of this bull market, and a new round of stock market cycles has already started since September 24 of last year.
The macro pricing in the first phase of the stock bull market revolves around two main lines: first, the Federal Reserve has restarted the interest rate cut cycle after four years, shifting monetary policy towards easing; second, China's export resilience provides important support for the overall economy and is also a significant source of risk preference for Chinese assets.
Table of Contents
Main Text
1. Signal 1: PPI as a Weak Signal for Stock Bull and Bear Markets
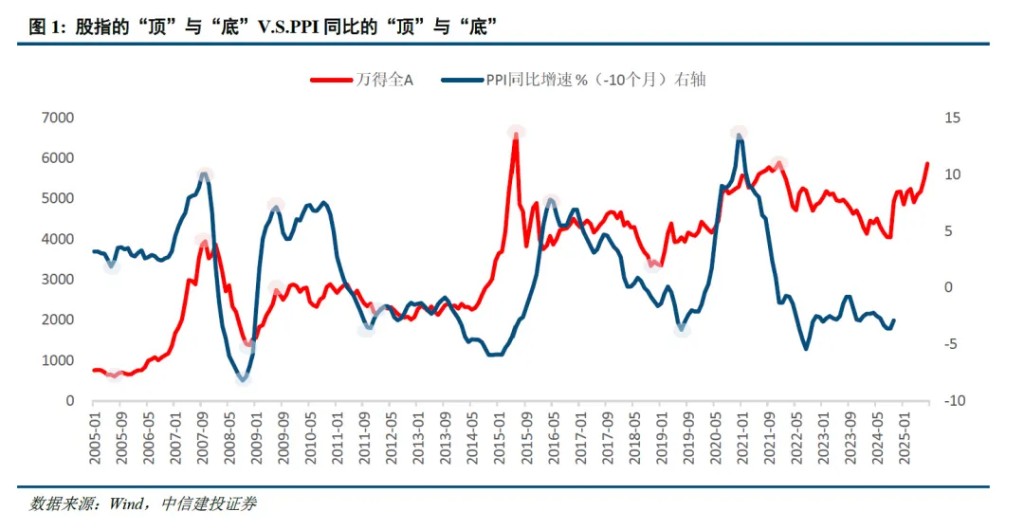
The bottom of the PPI often points to the bottom of the stock market. In other words, a bottoming out of the PPI indicates the start of a stock bull market. This signal is relatively robust, but unfortunately, the PPI bottom often lags behind the stock bottom, and the time lag between the stock market bottom and the PPI bottom is not stable, hence we also refer to it as a "weak signal."
In the first bull market (June 2005 - October 2007), the economic fundamentals were strong, prices were generally moderate, and the Wind All A Index led the PPI cycle by 10 months The second round of the bull market (November 2008 - August 2009) saw liquidity easing driving global economic cycle resonance, with the Wind All A Index leading the PPI cycle by about 10 months.
The third round of the bull market (May 2014 - June 2015) experienced a shift in economic growth, with the market pricing in deflation in advance. The Wind All A Index's low point led the PPI low point by about 16 months, and the stock market high point led the PPI by about 20 months.
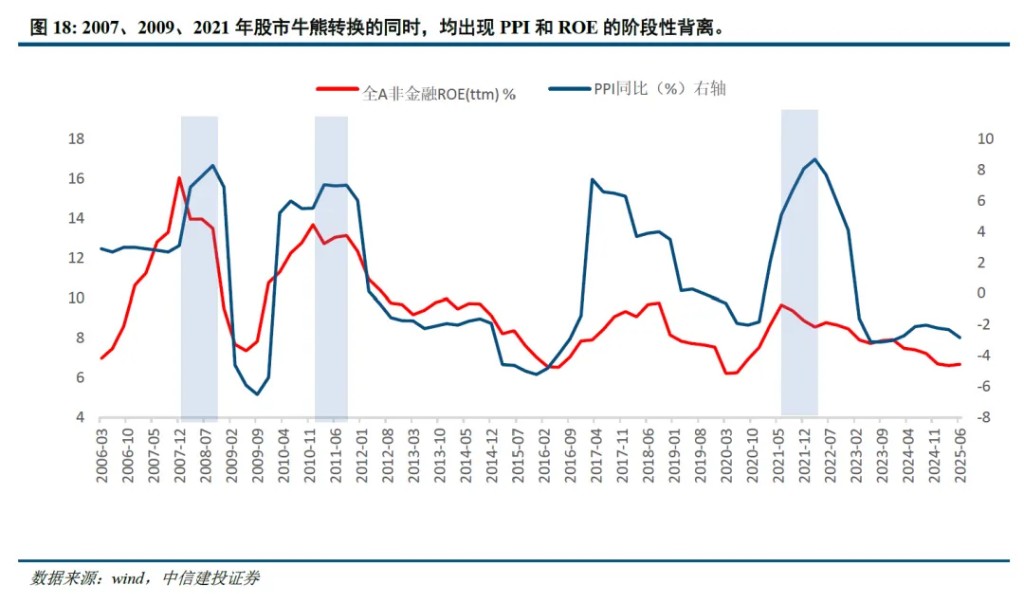
The fourth round of the bull market (January 2019 - December 2021) saw exports rising against the trend, with the Wind All A Index and PPI showing a phase divergence before synchronizing, with the Wind All A Index low point leading the PPI by 16 months.
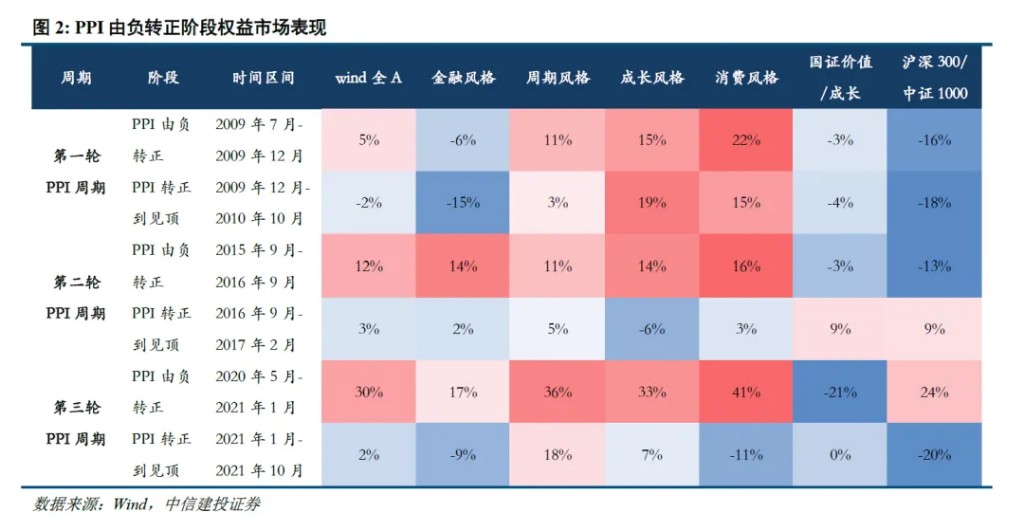
Since 2008, the PPI has experienced three rounds of turning from negative to positive, all accompanied by a rebalancing of market styles, but the rules of style switching are not entirely consistent.
Since 2008, the PPI has experienced three rounds of turning from negative to positive, specifically in December 2009, September 2016, and January 2023.
The first PPI upward cycle (July 2009 - October 2010) saw industry sector prosperity spreading, with both growth and cyclical styles performing well. Before the PPI rose to its peak, the dominant cyclical sector style gradually switched to consumption and growth.
The second PPI upward cycle (September 2015 - February 2017) saw the market style significantly leaning towards cyclical and value after the PPI turned positive.
The third PPI upward cycle (May 2020 - October 2021) saw the high prosperity growth mainline gradually switch to undervalued pro-cyclical sectors, ultimately leading to the small-cap style overall leading during the PPI peak phase.
The reason why the PPI has a "weak" signal significance for stock bull markets lies fundamentally in the following three factors.
First, the PPI bottoming out is usually seen as an important signal for the economic cycle turning towards recovery, and the stock market often reflects this expectation in advance, with domestic policy signals also aiding this process.
Second, the PPI peaking is usually accompanied by the economy entering overheating and financial conditions tightening, which is typically a macro environment for the end of a bull market. The PPI peak itself is also a result of policy tightening, hence stocks peak ahead of the PPI.
Third, the PPI turning positive is often accompanied by a rebalancing of stock market styles, but the direction of style switching needs to consider whether the driving force behind the PPI turning positive comes from domestic demand or external demand, the direction of domestic policy, and whether the stock market has priced in advance.
2. Signal 2: Non-ferrous PPI has a strong signal for the initiation of stock bull markets
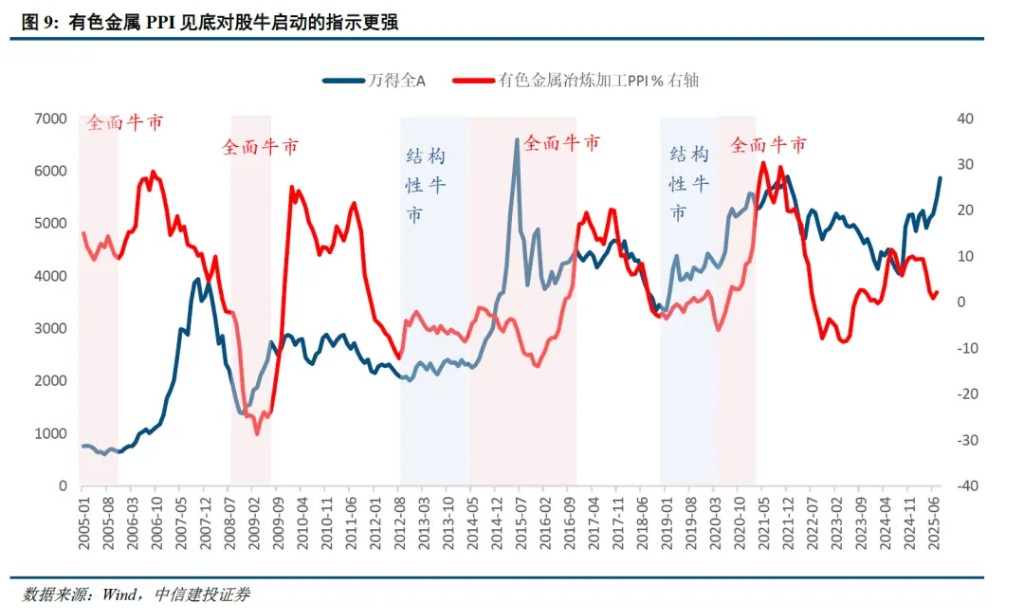
The bottoming of the non-ferrous PPI can indicate the initiation of a stock bull market. Historically, the bottoming of non-ferrous metal price cycles has generally coincided (or even slightly led) with the initiation of stock bull markets, making this signal very clear and effective. Therefore, we call it a "strong signal."
The first round of the non-ferrous metal PPI cycle started in April 2005, while the Wind All A Index bottomed in June 2005, with non-ferrous metal prices leading the stock market cycle by 2 months.
The second round of the non-ferrous metal PPI bottomed year-on-year in March 2009, while the Wind All A Index rebounded from its bottom in November 2008. Although the performance of non-ferrous metal prices in this round lagged the stock market by 4 months, the synchrony was still significantly better than the overall PPI (which lagged the stock market cycle by 10 months) The third round of non-ferrous metal PPI turned into low-level fluctuations in 2012, with the first bottom appearing in March 2014 and a second bottom in December 2015; during the same period, the stock market entered a comprehensive bull market in May 2014 after the structural bull market of the ChiNext in 2013. The first bottom of the non-ferrous metal PPI roughly led the comprehensive bull market by 2 months.
The fourth round of non-ferrous metal PPI first bottomed out in January 2019 and hit a second bottom in April 2020. During the same period, the stock market began a new round of bull market in January 2019. The first bottom of the non-ferrous metal PPI synchronized with the stock market cycle.
Non-ferrous PPI can also capture signals of a comprehensive bull market.
Firstly, if the rebound in non-ferrous prices fails to transmit to the overall PPI, the A-share market will show significant structural characteristics.
Historically, in the early stages of previous bull markets, there would be a process where the rebound in non-ferrous prices transmitted to the overall PPI, with both gradually moving from previous differentiation to a similar trend, and the prosperity of the equity market synchronously spreading, making the characteristics of a comprehensive bull market more significant. Typical cases include the market-wide rise from 2005 to 2007, 2014 to 2015, and 2020 to 2021.
Secondly, if the rebound in non-ferrous prices fails to transmit to the overall PPI in stages, the A-share bull market will exhibit stronger structural characteristics.
A typical case is the ChiNext bull market in 2013 and the "core assets" bull market in 2019 (where the consumption and technology sectors outperformed).
The strong signal of non-ferrous PPI for the initiation of stock bull markets penetrates to the underlying factors because the rebound in non-ferrous metal prices reflects global liquidity easing and a recovery in export demand, which is the basic macro pricing environment for the first phase of the bull market (liquidity bull).
In the price system of industrial products, non-ferrous metal prices often lead the overall PPI index to turn points, mainly due to their strong financial attributes and sensitivity to export demand.
Firstly, the prices of non-ferrous metals, represented by copper, are highly sensitive to global interest rates and liquidity environments, quickly reflecting changes in global macro expectations.
Secondly, non-ferrous metals are widely used in industries such as electricity, electronics, construction, and automobiles, and their demand is closely related to the prosperity of global manufacturing and trade activities, allowing them to capture signals of recovering export demand ahead of time.
Although the prices of non-ferrous metals and domestic PPI cycles are highly synchronized, they are not completely synchronized; the phase differentiation between the two reflects the differentiation of domestic and foreign economic and policy cycles.
In both 2013 and 2019, there was a significant differentiation in domestic and foreign economic and policy cycles, with a clear characteristic of "tight domestic and loose external" liquidity. This differentiation not only directly led to structural differentiation in PPI but also influenced the performance of the capital market.
Three, Signal 3, the strong signal of black PPI for the peak of stock bull markets.
Since 2005, in the four rounds of bull market cycles, black metal prices have mostly lagged behind the peaks of stock market cycles. This relationship is relatively robust, which is why we also call it a "strong signal."
The first round of black metal PPI peaked in August 2008, while the Wind All A Index peaked in October 2007, with black metal prices peaking 10 months after the stock market high The second round of the black metal PPI cycle peaked in October 2010, while the Wind All A Index peaked in August 2009, with black metal prices peaking 14 months after the stock market high.
The third round of the black metal PPI year-on-year peaked in February 2017, but the high point of this bull market was in June 2015, with a second peak in November 2017, and the peak of black metal prices lagged the stock market high by 20 months.
The fourth round of the black metal PPI year-on-year peaked in October 2021, while the Wind All A Index peaked in December 2021, lagging the year-on-year high of black metal prices by 2 months.
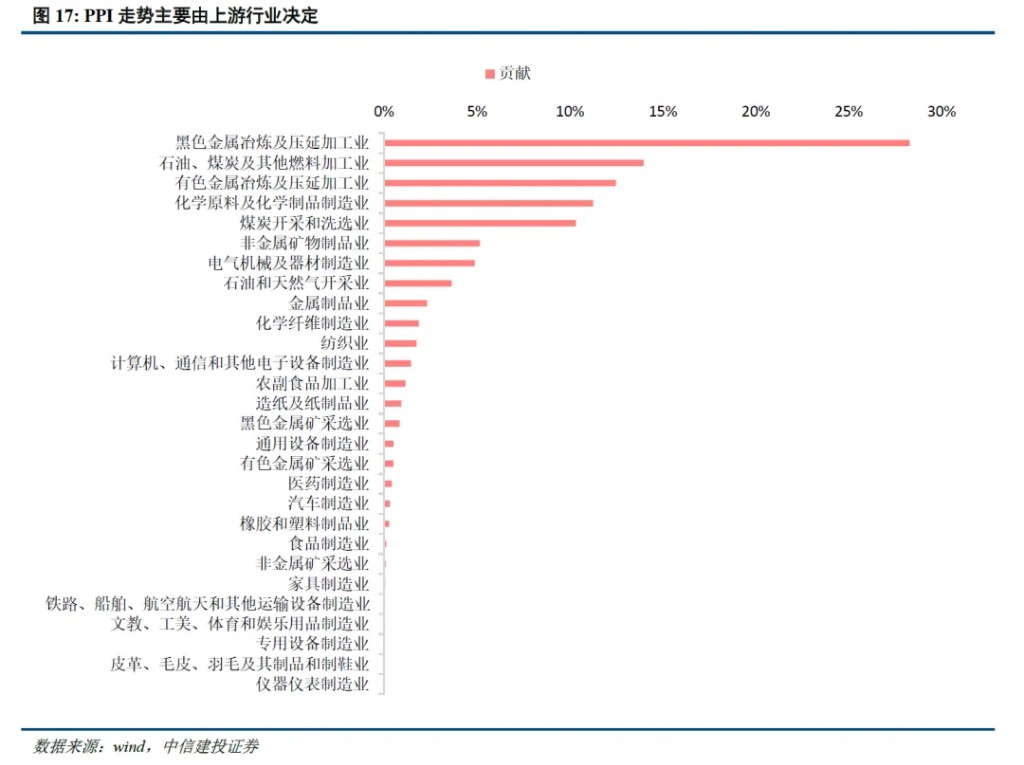
The black PPI has a strong signal for the transition from bull to bear markets, penetrating to the underlying level. After the black prices rise, there often occurs a transition between bull and bear markets in the stock market, directly manifested as commodity prices becoming overheated, followed by a decline in economic momentum and policy tightening suppressing stock prices. Essentially, the PPI trend dominated by upstream sectors does not completely synchronize with the profits of midstream and downstream industrial enterprises.
Firstly, the PPI trend is determined by upstream and midstream industries, with black prices contributing significantly to PPI fluctuations (20%-30%), synchronizing with the PPI cycle.
Secondly, industrial profits are closely linked to midstream and downstream sectors. In the late stage of PPI rising, the performance of upstream industry PPI and downstream industry profits may diverge.
Four, the indicative significance of PPI for stock bull markets: the linkage between PPI and industries.
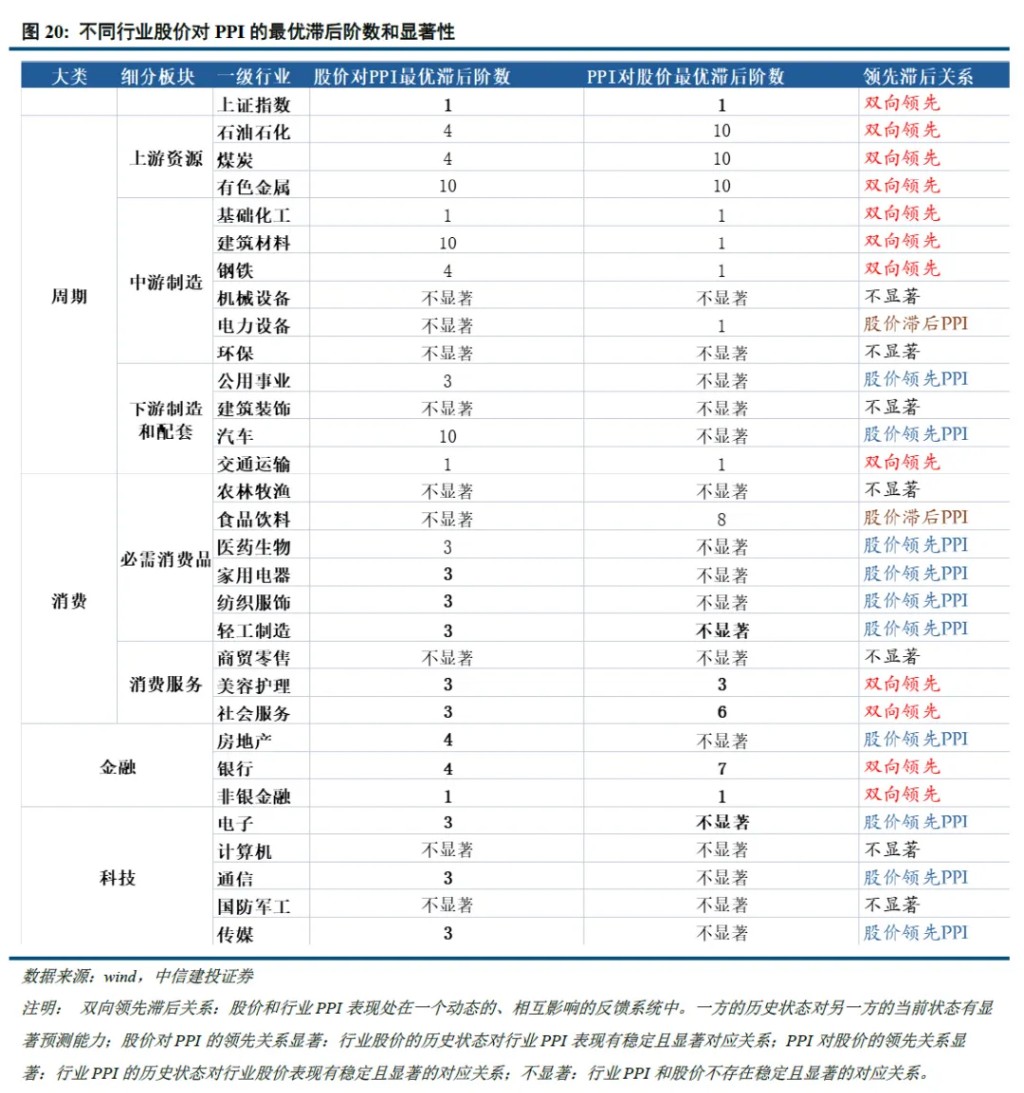
Based on the differentiated cyclical attributes of different industries, we selected the time frame from 2006 to 2024 to measure the stability and leading-lagging relationship between industry stock price cycles and PPI cycles, which can more clearly capture the sector rotation patterns guided by the PPI cycle.
Firstly, sectors with strong PPI cyclical attributes include cyclical, consumer services, and financial sectors. The stock price performance of these three categories of industries mostly exhibits a significant bidirectional leading-lagging relationship with PPI, with the stock price cycle and PPI cycle being most closely linked.
Secondly, sectors with early PPI cyclical attributes include essential consumer goods and technology sectors. The stock price performance of these two categories of industries mostly shows a more obvious early cyclical attribute, with stock price performance stabilizing ahead of PPI changes.
Thirdly, the stock price performance of the food and beverage industry has a typical post-PPI cyclical attribute, lagging behind PPI changes.
Fourthly, some sub-sectors have weak PPI cyclical attributes. Calculations show that the stock price performance of seven sub-sectors, including machinery and equipment, environmental protection, construction decoration, agriculture, forestry, animal husbandry and fishery, commerce and retail, computers, and national defense and military industry, does not exhibit a significant leading-lagging relationship with PPI.
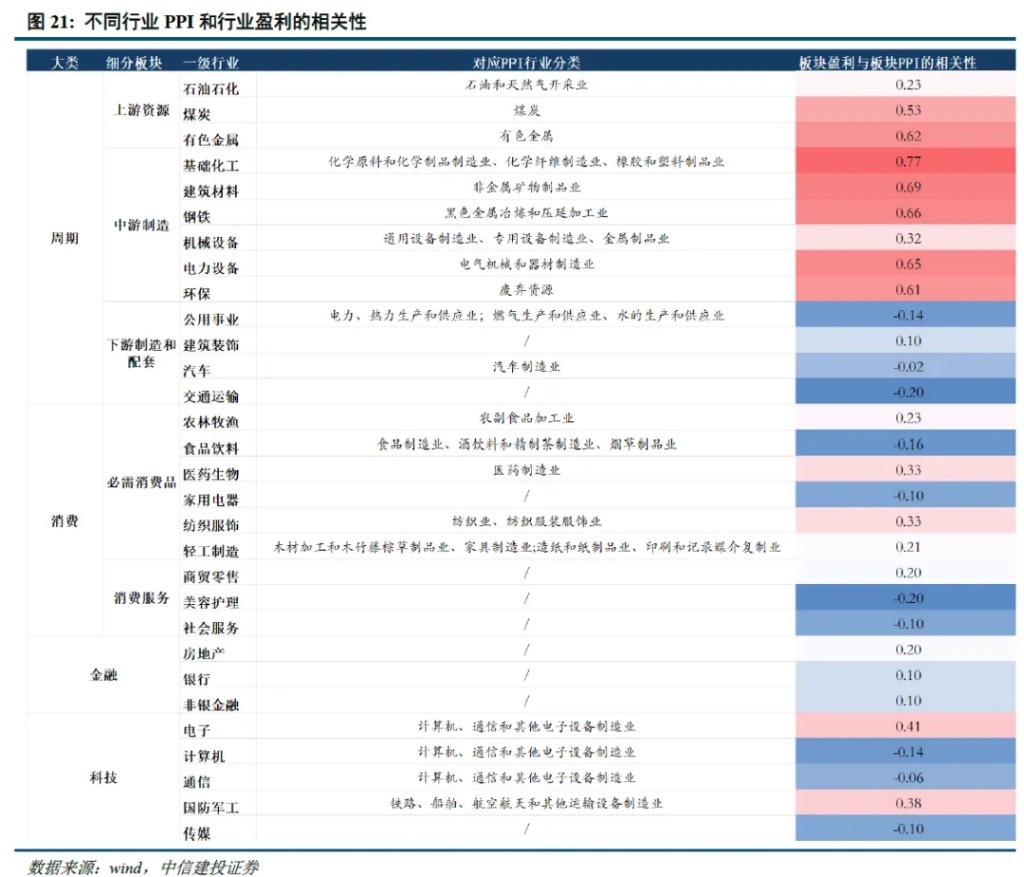
Penetrating to the underlying level, PPI is an important observation window for industrial enterprise profitability, but it is only one of the factors for assessing corporate profitability. The sensitivity of profitability to PPI changes varies significantly across different industries.
Upstream and midstream cyclical industries often directly benefit from product price increases, with the most obvious improvement in profitability.
The profitability of non-cyclical industries is not sensitive to PPI changes, which may be related to factors such as product technological barriers, industry competition structure, and demand elasticity.
For example, essential consumer sectors such as food and pharmaceuticals have low demand price elasticity, limited pricing power, and profitability relies more on sales volume and cost control. In contrast, the demand for products in technology sectors such as computers and communications is driven more by technological iteration, consumer electronics cycles, global digitalization processes, and emerging applications, with limited correlation to PPI, which reflects demand in traditional industrial sectors V. Interpretation of the Current PPI Trend and Stock Market Guidance
From a forward-looking signal perspective, the stabilization and rebound of non-ferrous metal prices still have strong indicative significance for the initiation of this bull market, with a new round of stock market cycle having started since September 24 last year.
The non-ferrous metal price index is expected to turn positive year-on-year in March 2024, which can still be seen as an early positive signal for the initiation of this bull market since September 24.
The macro pricing in the first phase of the bull market revolves around two main lines: first, the Federal Reserve has restarted its interest rate cut cycle after four years, shifting monetary policy towards easing; second, exports have achieved significant recovery growth compared to 2023, providing important support for the overall economy.
At this stage, the prosperity of non-ferrous metal prices has not yet spread to the overall PPI, and the bull market still exhibits strong early structural characteristics.
Since the beginning of this year, the divergence in prices of non-ferrous and ferrous metals has not shown significant convergence, as the underlying domestic and external demand cycles have not yet achieved synchronous resonance.
On one hand, the price resilience of non-ferrous metals, represented by copper, is overall strong, directly pointing to the resilience of Chinese exports and the trend of global liquidity easing; on the other hand, domestic ferrous industry chain prices have not completely escaped the year-on-year decline channel, indicating weakness in domestic real estate and infrastructure investment.
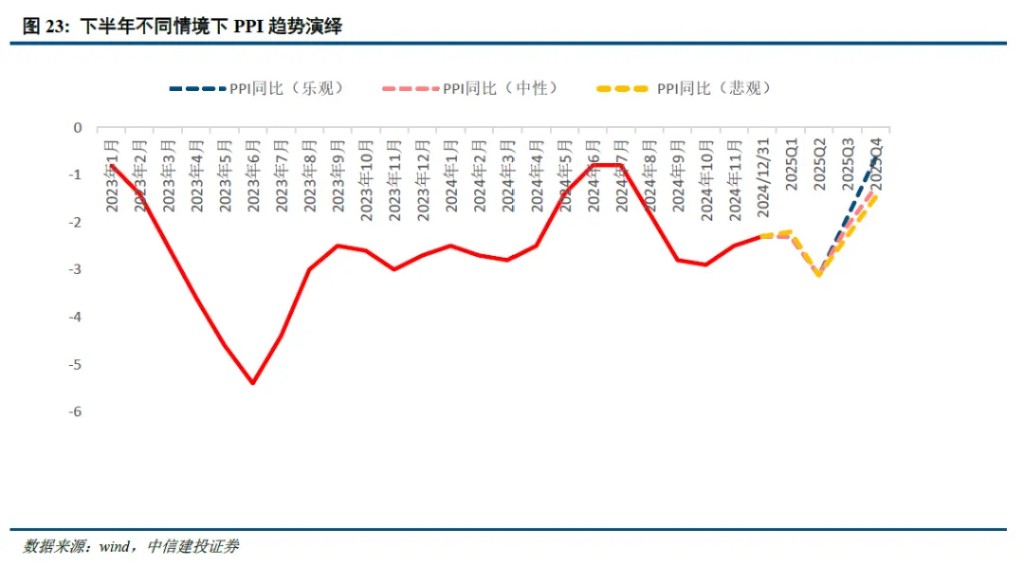
We assess the PPI trend by judging the scenarios of copper, crude oil, and steel prices. In all three scenarios, the PPI midpoint for the second half of the year is less than 0 (-1.3, -1.7, -1.9).
Correspondingly, the structural characteristics of market performance are further strengthened. Similar to 2013 and 2019, industries with early-cycle attributes such as technology and pharmaceuticals continue to outperform, while traditional cyclical industries (coal, steel, transportation, etc.) perform generally.
Looking ahead, since the anti-involution narrative in July, the prices of the ferrous industry chain, which are priced based on domestic demand, have shown their first month-on-month positive growth this year, and if this positive trend can continue, it may become an important trigger for the market style switch from growth to value.
In August, the ferrous smelting and processing sector achieved its first positive month-on-month growth this year, indicating that the effects of the "anti-involution" policy are beginning to show. However, the continuation of the positive trend in ferrous prices still depends on the sustainability of supply constraints and whether domestic demand can effectively take over from exports.
Based on effective "anti-involution," which is not merely a simple supply constraint, the key variable determining price performance remains domestic demand, especially the stability of the real estate chain. A complete style switch requires the market to see certainty in the profit improvement of traditional cyclical sectors, as well as a genuine stabilization in core domestic demand areas such as real estate.

This article is authored by Zhou Junzhi and Chen Yi, sourced from CSC Research Macro Team, original title: "The Signal of PPI to Stock Bull | JianTou Macro · Zhou Junzhi Team"
Risk Warning and Disclaimer
The market has risks, and investment requires caution. This article does not constitute personal investment advice and does not take into account the specific investment goals, financial conditions, or needs of individual users. Users should consider whether any opinions, views, or conclusions in this article are suitable for their specific circumstances. Investment based on this is at one's own risk
