
Goldman Sachs: How do U.S. stocks price economic data currently? How does fiscal risk affect the U.S. dollar?

Goldman Sachs analysis believes that the current pricing of economic data in the U.S. stock market reflects an optimistic growth outlook, with a rotation between cyclical and defensive stocks. Although the May non-farm payroll data showed resilience, economic data may soften in the coming months, raising concerns among investors. At the same time, due to issues of fiscal sustainability and weakened demand from foreign investors for U.S. assets, the dollar may face a dual impact of higher yields and weakness. Goldman Sachs expects to increase investments by approximately $20 billion in the next month
According to the Zhitong Finance APP, Goldman Sachs believes that the U.S. non-farm payroll data for May remains resilient, and the stock market is pricing in an optimistic growth outlook. The risks associated with the market's pricing of economic growth have both upside and downside. A significant deterioration in economic data could challenge investors' ability to overlook recent weakness. Conversely, there is still room for improvement in soft data, which would support the continued upward movement of the stock market. Regarding the dollar, concerns about U.S. fiscal sustainability and weakened demand from foreign investors for U.S. assets may make fiscal expansion more costly through the dual channels of higher yields and a weaker dollar.
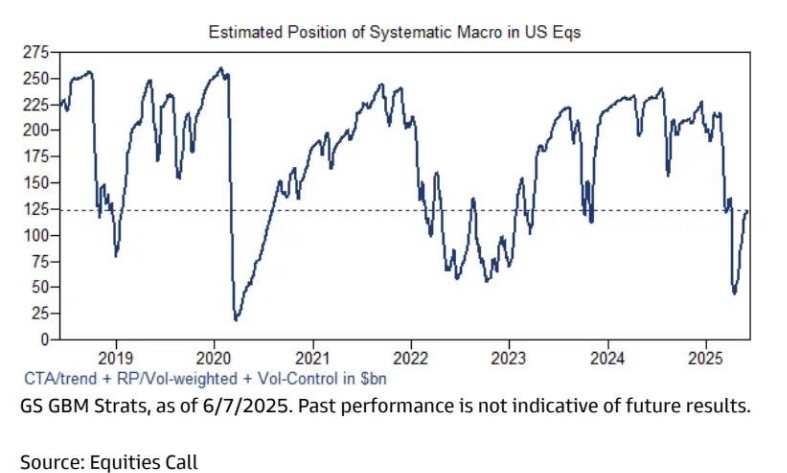
Goldman Sachs' global equity systematic macro strategy positioning shows that there was a slight buying trend last week, with the position size approaching the historical median (about 5 out of 10 on a scale), and it is expected to continue increasing by about $20 billion over the next month under the baseline scenario (with nearly half flowing into the U.S. market).
1. How does the market price economic data?
Goldman Sachs' report points out that last week's strong employment report highlighted the ongoing resilience of hard economic data. In May, non-farm payrolls increased by 139,000, and the unemployment rate remained at 4.2%. However, despite the robustness of hard economic data so far, it is expected that data will soften in the coming months.
The internal rotation of the stock market indicates that investors are pricing in an optimistic growth outlook. The performance of cyclical stocks versus defensive stocks reflects an expected environment of about 2% growth in U.S. real GDP. Goldman Sachs economists expect real GDP growth to be around 1% over the next four quarters. Many clients have expressed concerns about the risks of market rebounds and growth pricing before growth data weakens. There are three reasons to downplay the anticipated resistance:
First, soft economic data has weakened in advance, typically stabilizing before hard data bottoms out. The correlation of the S&P 500 index returns is currently higher with soft data than with hard data. If the recovery of soft data continues, it should support stock market returns even if hard data weakens.
Second, investors may be overlooking recent weakness while looking ahead to 2026. Goldman Sachs economists predict that the quarter-on-quarter annualized growth rate of U.S. real GDP will slow to 0.4% in the fourth quarter of 2025, but will rebound to 2.0% by the fourth quarter of 2026.
Third, Goldman Sachs' industry-neutral basket of economically sensitive stocks shows growth expectations slightly lower than the combination of cyclical and defensive stocks. The median valuation of high operating leverage stocks (GSTHOPHI) is close to the historical maximum discount compared to low operating leverage stocks (GSTHOPLO).
Goldman Sachs believes that the risks associated with the market's pricing of economic growth have both upside and downside. A significant deterioration in economic data could challenge investors' ability to overlook recent weakness. Conversely, there is still room for improvement in soft data, which would support the continued upward movement of the stock market.
Chart 1: Pricing of economic growth by cyclical and defensive stocks
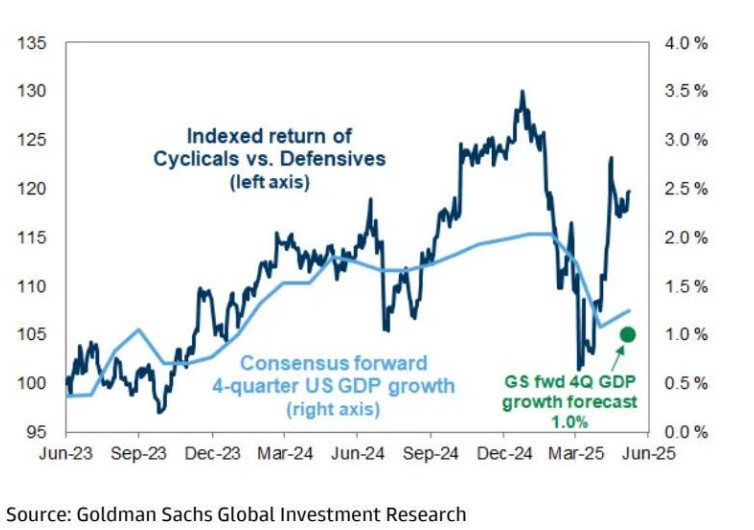
(Left axis: Returns of cyclical stocks and defensive stock indices; Right axis: Market consensus expectations and Goldman Sachs' forecast for U.S. GDP growth over the next four quarters)
Chart 2: The S&P 500 index and soft data typically bottom out before hard data
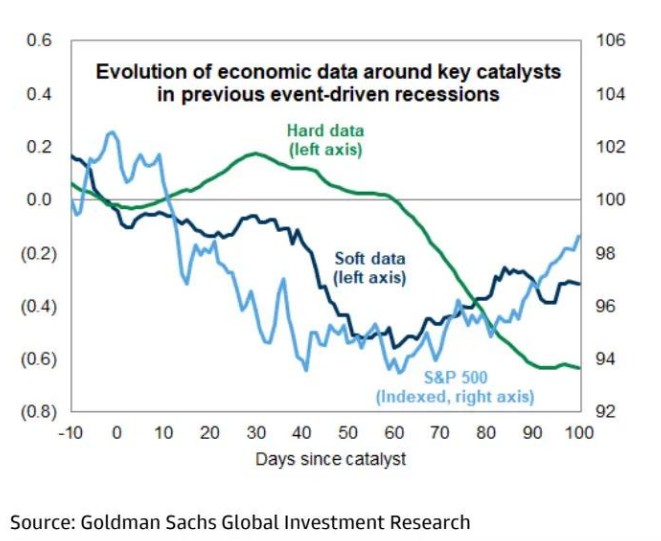
(Left axis: Changes in hard data and soft data; Right axis: Indexed performance of the S&P 500 index, with key catalyst events as benchmark dates)
Chart 3: The S&P 500 index rebounds with soft data, while hard data remains stable
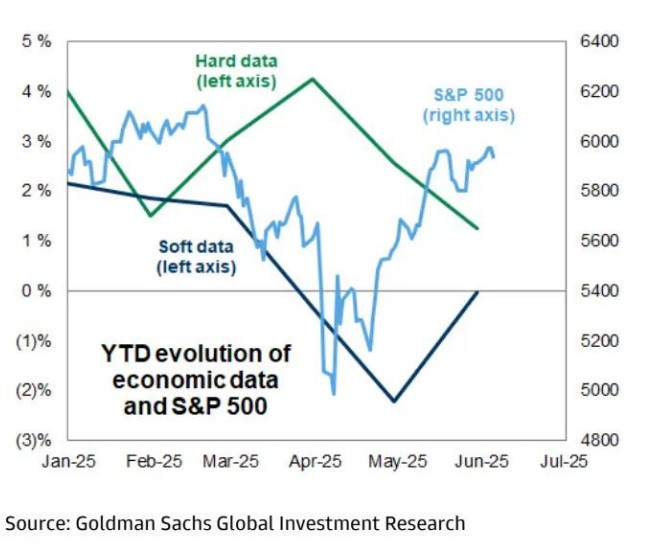
(Left axis: Year-to-date changes in hard data and soft data; Right axis: S&P 500 index points)
Chart 4: Correlation between S&P 500 index returns and hard/soft data
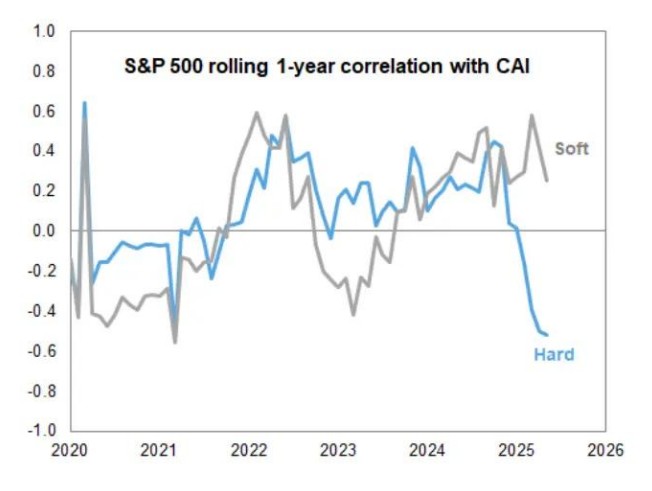
(Based on monthly CAI data and the 12-month rolling correlation of monthly returns of the S&P 500 index)
II. How does fiscal risk affect the U.S. dollar?
Kamakshya Trivedi, a global foreign exchange trader at Goldman Sachs, stated that as summer approaches, the dollar index has fallen about 6% year-to-date, completely reversing the gains made in April 2024. Meanwhile, over the past six weeks, the dollar has remained relatively flat against other developed market currencies. Therefore, it is not surprising that investors now perceive a greater two-way risk surrounding this currency than ever before. However, despite this adjustment being swift and significant—typical behavior near a currency peak—Goldman Sachs still believes that this is more of a "beginning of the end" for the dollar's transformation rather than an "end of the beginning."
Goldman Sachs has adjusted its forecasts for the euro/dollar to 1.17, 1.20, and 1.25 for 3 months, 6 months, and 12 months respectively (previously 1.1, 1.15, and 1.20).
Fiscal sustainability has become a focal point for investors, not only in the U.S. but also in the U.K. and Japan. The timing of budget procedures has led the market to focus on the U.S.'s massive and persistent fiscal deficit, as investors have been concerned about the sustainability of foreign demand for U.S. assets The impact of fiscal expansion on the US dollar has been mixed empirically, often depending on the state of the economic cycle and monetary policy. On average, an increase in the net issuance of US Treasury bonds tends to be favorable for the dollar. This is partly due to the structural demand for US Treasuries from foreign investors—foreign capital inflows typically increase with the net issuance of US Treasuries, which is an advantage not possessed by the US's G10 peers.
However, with the weakening of American exceptionalism and fiscal risks, the willingness of foreigners to absorb US assets may decline, potentially altering the dollar's response to fiscal expansion. In local markets, Goldman Sachs has found differences in how various foreign exchange currencies price US fiscal risks. A sharp widening of the yield spread between US 5-year and 30-year Treasury bonds often exerts greater pressure on high-yield currencies such as the Brazilian real, Mexican peso, and Indian rupee, although recent evidence suggests that emerging market local interest rates have become more resilient to rising US Treasury yields. Meanwhile, a sharp widening of US credit default swap (CDS) spreads is typically associated with poor performance of more cyclical currencies like the South African rand, Norwegian krone, and Australian dollar.
Although investors have accepted higher yields as adequate compensation for holding US Treasuries in recent years, concerns about fiscal sustainability and a weakening demand from foreign investors for US assets may make fiscal expansion more costly through the dual channels of higher yields and a weaker dollar.
Chart 1: Concerns about fiscal sustainability have led to a brief but severe dislocation between the dollar and interest rates, although this relationship has recently normalized.
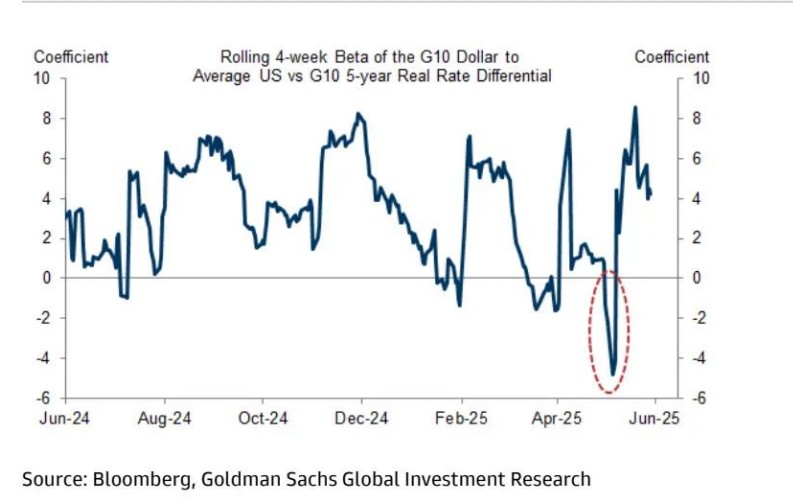
(4-week rolling beta coefficient of G10 currency exchange rates against the dollar and the actual yield differential of US 5-year Treasuries)
Chart 2: Historically, an increase in the net issuance of US Treasuries has been favorable for the dollar, but has had a smaller impact on other G4 economies.
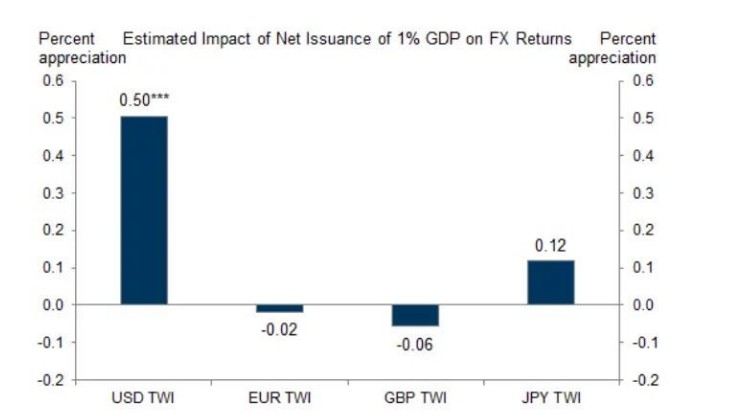
(Estimated percentage impact on exchange rate returns from a 1% net issuance of Treasuries as a share of GDP)
Chart 3: Foreign demand for US Treasuries typically rises with increased net issuance.
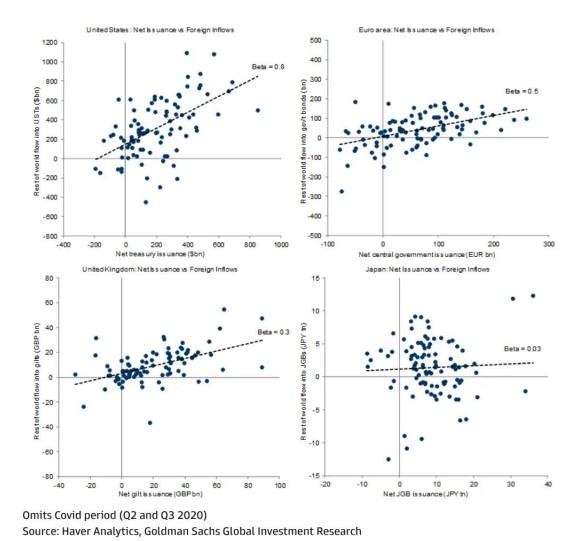
(Net issuance of US Treasuries and foreign capital inflows; comparison with net issuance of Eurozone, UK, and Japanese government bonds and foreign capital inflows)
