INDUSTRIAL SECURITIES in-depth review: How was the independent market of A-shares forged?

Zhitong
2025.03.15 06:26
portai
I'm PortAI, I can summarize articles.

INDUSTRIAL SECURITIES released a research report analyzing the reasons for the formation of an independent market for A-shares, pointing out that the misalignment of economic and policy cycles between China and the United States is an important factor for market differentiation. Domestic liquidity easing has helped A-share valuations rise rapidly, while U.S. stocks face fluctuations or declines. The report reviews three historical periods when A-shares decoupled from U.S. stocks, emphasizing that A-shares have a comparative performance advantage during periods of declining U.S. stock earnings

According to Zhitong Finance APP, INDUSTRIAL SECURITIES released a research report stating that the misalignment of economic and policy cycles between China and the United States may be an important reason for the divergence of the Chinese and American stock markets. Further breaking down valuations and earnings, it can be seen that with the misalignment of policy and economic cycles, the valuations and earnings of the Chinese and American stock markets are also diverging. The more relaxed liquidity in China benefits the rapid rise in A-share valuations, while U.S. stock valuations are mainly fluctuating or declining; in terms of earnings, the "strong China, weak America" scenario often occurs during the earnings downturn period of U.S. stocks, during which A-shares have a certain performance comparative advantage.

The following is the research report:

Introduction: Since mid-February, U.S. stocks have led a significant decline in global markets, while the A-share market has continued to rise, with the Shanghai Composite Index reaching a new high for the year. The Hong Kong stock market, which has previously been easily affected by overseas fluctuations, has also experienced an unusual surge, leading to a rising call for "the East rises while the West falls."

Why can Chinese assets achieve an independent market trend? Where will it go in the future? To find the answer, we systematically reviewed the historical experiences of three periods of decoupling between A-shares and U.S. stocks, and the independent rise of A-shares from September 2000 to June 2001, November 2008 to March 2009, and July 2014 to June 2015, in order to provide references for the current market. Please refer to the report for details:

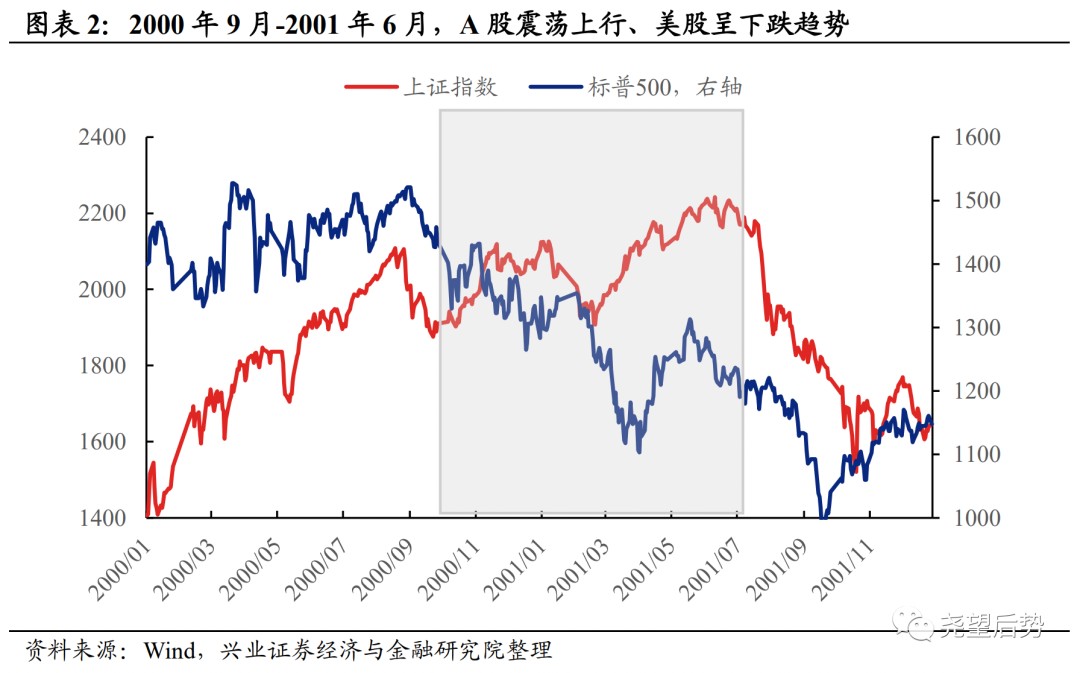
1. The First Round: September 2000 - June 2001, Resilient A-shares Amid U.S. Recession

From the end of September 2000 to the end of June 2001, the Shanghai Composite Index, Shenzhen Component Index, and Wind All A Index rose by 18.9%, 7.4%, and 15.3%, respectively, while the S&P 500, Dow Jones, and Nasdaq fell by 15.3%, 2.8%, and 45.2% during the same period. The excess return of A-shares relative to U.S. stocks (the difference in the percentage change between the Shanghai Composite Index and the S&P 500) was 34.2%.

1.1. The "5.19 Market" Underpinned by Fundamental Recovery + Loose Liquidity + Policy Support

To stabilize the economy, the central government accelerated policy easing starting at the end of 1997. In response to the continued decline in domestic economic growth and the impact of the Asian financial crisis, the central bank continued to lower the deposit and loan interest rates by 1.1% and 1.5%, respectively, on October 23, 1997. Meanwhile, the People's Daily published a commentary article, pointing out that this interest rate cut was a significant measure to timely grasp the control intensity under the moderately tight monetary policy. Subsequently, at the "Two Sessions" held in early 1998, the Premier proposed the "8% target" in the government work report, which aimed to ensure that the economic growth rate would not be lower than 8%. Following this, a series of policy measures were proposed, including: (1) implementing an active fiscal policy, issuing 100 billion yuan in government bonds each year for large-scale infrastructure construction, etc. According to statistics, from 1998 to 2001, authorities issued 510 billion yuan in long-term construction bonds, while major state-owned commercial banks also provided an equivalent amount of "matching funds"; (2) granting private enterprises autonomy in foreign trade import and export; (3) liberalizing the real estate market to stimulate domestic demand. On May 9, 1998, the central bank issued the "Personal Housing Loan Management Measures," allowing commercial banks to provide housing mortgage loan services On June 29, the State Council decided to stop the practice of distributing welfare housing in kind, which had been in place for over 40 years, starting from July 1, and to promote the monetization of housing distribution. From then on, the Chinese real estate market completely embarked on a path of commercialization. (4) Injecting capital into state-owned commercial banks to resolve financial risks. In November 1998, the Ministry of Finance issued 270 billion yuan in special government bonds to supplement the capital of four state-owned banks, with the special government bonds purchased using the available funds increased after the statutory reserve requirement ratio was lowered in March. Subsequently, in 1999, four Asset Management Companies (AMCs) were established to strip nearly 1.4 trillion yuan of non-performing assets from the four major commercial banks and the China Development Bank.

In addition, state-owned enterprises began a "three-year rescue" campaign. In July 1997, Premier Zhu Rongji emphasized during an inspection of state-owned enterprises in Liaoning that "to achieve the goal set by the Central Committee of the Communist Party and the State Council of establishing a modern enterprise system in most large and medium-sized backbone state-owned enterprises by the end of the 20th century, we must have firm confidence and work solidly, using about three years to help most large and medium-sized loss-making state-owned enterprises out of difficulties, which is an important task for economic work in the coming years." In September 1997, the report of the 15th National Congress of the Communist Party pointed out: "Strive to establish a modern enterprise system in most large and medium-sized backbone state-owned enterprises by the end of this century, with significantly improved operating conditions, creating a new situation for the reform and development of state-owned enterprises." Thus, the three-year goal for the reform and rescue of most large and medium-sized state-owned enterprises was established.

In 2000, China's economic growth rebounded and emerged from the deflationary predicament. With monetary and fiscal policies remaining accommodative, and after shedding heavy burdens, the national economy, led by state-owned enterprises, began to gradually recover under a series of policy combinations, with domestic economic mild recovery and domestic industrial product prices gradually stabilizing and rising. In 2000, China's GDP recorded a year-on-year growth of 8.49%, an increase of 0.83 percentage points compared to 1999, ending the previous eight years of declining economic growth. Additionally, after entering 2000, China's PPI and CPI year-on-year growth rates successively rebounded to positive growth ranges, ending the previous deflationary predicament.

Moreover, on the policy front, as the decision-making level turned its attention to the capital market in mid-1999, the positioning of the capital market was comprehensively elevated. On May 12, 1999, the State Council officially approved the China Securities Regulatory Commission's submission of "Several Policies for Further Standardizing and Promoting the Development of the Securities Market," and on June 15, the People's Daily published a special commentary article titled "Firm Confidence, Standardized Development," pointing out that "the good situation of the securities market is hard-won, and all parties must cherish it." Igniting enthusiasm for capital market entry. On July 28, the China Securities Regulatory Commission (CSRC) issued the "Notice on Further Improving the Stock Issuance Method," allowing state-owned enterprises, state-controlled enterprises, and listed companies to invest in the primary stock market. On August 19, the People's Bank of China released the "Regulations on Fund Management Companies Entering the Interbank Market" and the "Regulations on Securities Companies Entering the Interbank Market," opening up financing channels for securities companies and fund management companies to enter the interbank lending market and the bond repurchase market. On September 30, the State Council issued the "Implementation Measures for Collecting Personal Income Tax on Savings Deposit Interest," promoting the conversion of savings deposits into securities margin. On October 26, the China Insurance Regulatory Commission allowed insurance funds to indirectly enter the stock market through funds. On November 15, the Central Economic Work Conference reiterated the need to increase the proportion of direct financing and to regulate and develop the capital market. In February 2000, the CSRC successively issued the "Management Measures for Securities Companies' Stock Pledge Loans" and the "Notice on Issues Related to the Allocation of New Shares to Secondary Market Investors." On March 17, the CSRC introduced the "Interim Measures for Guidance on Stock Issuance and Listing," stating that it would no longer impose restrictions on the price-to-earnings ratio for stock issuance.

With the recovery of the domestic economy and corporate profits, a loose liquidity environment, and the intensive release and implementation of previous domestic capital market support policies, the A-share market quickly entered a new round of increases from mid-May 1999 to late June 2001 after entering the new century. On the profit side, since 1999, the growth rate of net profit attributable to the parent company of A-shares has shifted upward compared to the previous central tendency. On the valuation side, against the backdrop of policy easing, capital interest rates have remained low, and the PE_TTM of the Shanghai Composite Index has gradually risen to around 65.

1.2, Panic in the U.S. Stock Market Amid Spreading Pessimistic Profit Expectations

Since 2000, U.S. economic growth has gradually slowed, and corporate profits have contracted. In the face of an overheating economy, from June 1999 to mid-2000, the Federal Reserve continuously raised interest rates, increasing the federal funds target rate from 4.75% to 6.5%. The tightening monetary policy quickly caused U.S. economic growth to decline, with the manufacturing PMI starting to fall in December 1999. Since Q1 2000, U.S. corporate profits, adjusted for inventory valuation and capital, have fallen into negative growth territory, and the unemployment rate rose by 0.2 percentage points to 4% in May 2000, while GDP year-on-year also peaked in Q2 2000. The downward turn in the fundamentals raised market concerns about a recession in the U.S. economy, reflected in the inversion of the 10-2 year U.S. Treasury yield in 2000.

Entering 2001, although the Federal Reserve began a rate-cutting cycle and the Bush administration continuously introduced active fiscal policies, it could not change the trend of U.S. economic recession. Faced with significant downward economic pressure and a continuously rising unemployment rate, the Federal Reserve cut interest rates multiple times starting in January 2001, cumulatively lowering the federal funds target rate by 150 basis points to 1.75%. Meanwhile, the White House also pushed forward several fiscal stimulus policies in an attempt to boost the economy, such as President Bush's introduction of the $1.35 trillion "Economic Growth and Tax Relief Reconciliation Act of 2001" on June 7 Despite the "double easing" of monetary and fiscal policies, the U.S. economy has completely fallen into a recession. By the end of 2001, GDP growth had continuously declined from a peak of 5.24% to 0.17%, while the unemployment rate soared to 5.7%.

From the decline in corporate profit expectations to the actual drop in profits, combined with relatively high valuations, U.S. stocks faced a "Davis double kill." On the earnings front, as the economy fell into recession and oil prices remained high, U.S. stock profits faced immense downward pressure. Since August 2000, Apple Inc. has issued three profit warnings, and the performance gradually disclosed in February 2001 further validated market concerns, with the Q4 2000 performance growth of tech giants like Microsoft and Intel falling far short of market expectations. Moreover, as the economy declined, pessimistic expectations for profits gradually spread from the tech sector to all U.S. stocks. From September 2000 to October 2001, the market continuously revised down its profit expectations for U.S. stocks, with the proportion of analysts lowering their S&P 500 profit forecasts rising from 18.4% to 46.4%. On the valuation front, although the Federal Reserve shifted its stance and long-term interest rates were in a downward channel, the pessimistic profit expectations still caused the S&P 500's valuation to drop from 26.7 in September 2000 to 23.5 in June 2001. Additionally, on March 5, 2001, Fortune magazine published an article titled "Is Enron's Stock Price Overvalued?", which kept the issue of financial fraud among listed companies simmering, compounded by the outbreak of the financial crisis in Argentina, leading to a plunge in market sentiment.

1.3. Why the Divergence Between Chinese and U.S. Stock Markets: Economic Cycles Continue to Misalign

China's economy is transitioning from recession to recovery, while the U.S. economy is moving from overheating to recession, resulting in a continuous misalignment of economic cycles between China and the U.S. The U.S. economy was in the "Golden 90s" and was less affected by the Asian financial crisis. From Q1 1996 to Q2 2000, U.S. GDP maintained a high growth rate of over 4%, while China's economic growth rate declined year by year. The "cold" and "hot" economic conditions in China and the U.S. led to different starting points for policy formulation by high-level officials in both countries at that time. From 1998 to 2000, to stabilize the economy, China's central bank continuously cut interest rates, and the government adopted loose fiscal policies, while the U.S. aimed to "cool down" the economy, with the Federal Reserve raising interest rates multiple times. Under the catalysis of policies with completely different directions, China's economy began to recover moderately, with GDP growth returning to over 8% in 2000, while the U.S. economy peaked and declined. Even with subsequent easing by the Federal Reserve and the White House, the U.S. economy found it "difficult to improve," with GDP year-on-year dropping from 5.2% in Q2 2000 to 0.2% in Q4 2001 The fundamental differences between "China strong, US weak" are highlighted.

A-shares "Davis Double Hit" vs US stocks "Davis Double Kill". In terms of earnings, the misalignment of economic cycles has led to a misalignment of corporate profit cycles. From 2000 to Q3 2001, the Chinese economy experienced a mild recovery, corresponding to an overall upward shift in the growth rate of net profit attributable to shareholders in A-shares, while the momentum of US economic growth continued to slow, corresponding to a downward trend in both earnings expectations and actual net profit growth in US stocks. In terms of valuation, the loose liquidity environment in China catalyzed the rise in A-share valuations, while the historically high valuations of US stocks were subsequently suppressed by tightening liquidity and pessimistic earnings expectations.

II. Second Round: November 2008 - March 2009, A-shares lead out of the bottom

From November 2008 to March 2009, the Shanghai Composite Index, Shenzhen Component Index, and Wind All A Index rose by 23.2%, 36.4%, and 42.6%, respectively, while the S&P 500, Dow Jones, and Nasdaq fell by 30%, 29.8%, and 26.5% during the same period, with A-shares achieving an excess return of 53.2% relative to US stocks.

2.1. The "Four Trillion Plan" catalyzes the V-shaped reversal of A-shares

In the second half of 2008, as the US subprime mortgage crisis deepened, the central bank made marginal adjustments to monetary policy to stabilize the domestic economic situation. In accordance with the requirement to "maintain stable and rapid economic development while controlling price increases," from July 2008, the central bank gradually reduced the scale and frequency of central bank bill issuance, raised the annual new loan target to over 4 trillion yuan, and guided financial institutions to expand the total credit volume. From September to the end of 2008, the central bank continuously lowered the benchmark interest rates for deposits and loans five times, reduced the reserve requirement ratio four times, and on October 27, expanded the downward adjustment range for commercial personal housing loan interest rates.

Even with the central bank's shift in monetary policy and multiple rescue measures, it was difficult to restore market confidence. From July 1 to November 4, A-shares cumulatively fell by 42%. After the central bank's marginal easing of monetary policy in July 2008, A-shares continued to decline after a brief fluctuation; on September 16, the central bank announced a rate cut confirming the policy shift to easing, but the market did not stabilize, and the Shanghai Composite Index fell by 4.47% that day, breaking below the 2000-point mark; On September 18, Central Huijin Investment Ltd. announced that it would independently purchase shares of Industrial and Commercial Bank of China, China Construction Bank, and Bank of China in the secondary market. Coupled with the change in stamp duty to a one-sided collection on September 19, this catalyzed the "919" market rally, with A-shares rising over 9.42% in a single day. However, after experiencing about a week of rebound, the market continued to decline. On October 8, the central bank announced another reserve requirement ratio cut and interest rate reduction. On October 9, the China Securities Regulatory Commission published the "Decision on Amending Certain Regulations on Cash Dividends of Listed Companies," aimed at encouraging listed companies to establish long-term dividend policies to stabilize stock prices, but it still struggled to change the downward trend of the market, with the Wind All A Index continuing to drop over 20%. It wasn't until the introduction of the "Four Trillion Plan" that the market officially bottomed out.

Despite the policy easing, the economy was still deteriorating at that time, leading the market to be skeptical about the effectiveness of policy stimulus. GDP growth continued to decline, and although monetary policy had turned accommodative, the growth rate of money supply was still slowing down, especially with a significant decrease in M1 growth. The real estate sector, affected by previous interest rate hikes and reserve requirement increases, saw sales data deteriorate rapidly, with development funds tightening comprehensively. The year-on-year growth rate of newly started construction area for housing had been declining since the beginning of the year, and by the second half of the year, the growth rate of fixed asset investment in real estate also began to decline, among other issues. All evidence led the market to suspect that it might have experienced a "false easing."

The introduction of the "Four Trillion Plan" marked a comprehensive intensification of easing policies, solidifying the "policy bottom." On November 5, 2008, the State Council proposed ten measures to promote growth, planning to invest 4 trillion yuan within two years to stimulate economic recovery. Subsequently, on November 11, the central bank explicitly canceled the hard constraints on credit planning for financial institutions, signaling its commitment to ensuring economic growth and stabilizing market confidence. On November 28, the Politburo meeting further defined "ensuring growth, expanding domestic demand, and adjusting structure" as the main tasks for the next year's economic work, requiring the continued implementation of proactive fiscal policy and moderately accommodative monetary policy.

In 2009, the domestic environment remained extremely loose in terms of monetary and credit policy, catalyzing a recovery in China's economy. In 2009, financial institutions added nearly 9.6 trillion yuan in new RMB loans, nearly doubling year-on-year, with long-term loans to residents increasing more than 3.8 times. M1 and M2 also returned to an upward trajectory year-on-year. Stimulated by the "Four Trillion Plan," infrastructure became an important stabilizer for the economy, with infrastructure investment growth reaching 42.16% for the year, driving GDP growth upward.

On November 5, 2008, the "Four Trillion Plan" was introduced, and with the continuous release of economic and financial data as evidence, strong policy stimulus improved market confidence, leading to a trend of rising markets. The Shanghai Composite Index rose from a low of 1,707 points in November 2008 to double by the end of July 2009. However, overall, this round of increase was largely a B-wave rebound after a significant decline, coinciding with massive monetary easing during the financial crisis, resulting in a rapid surge.

2.2. The "twists and turns" of the economic recovery process led to a W-shaped double bottom in the US stock market

After the outbreak of the financial crisis, the US government urgently intervened to rescue the market. On September 7, 2008, the federal government took over Fannie Mae and Freddie Mac. On September 16, AIG was taken over by the government and approved for an $85 billion loan from the Federal Reserve. On September 18, the Federal Reserve and five other central banks jointly announced the injection of up to $180 billion into the financial system. On September 20, the US government submitted a financial rescue plan (TARP plan) of up to $700 billion to Congress, which was ultimately approved on October 3. On September 25, the Federal Deposit Insurance Corporation (FDIC) took over Washington Mutual, the largest savings bank in the US. On October 8, the Federal Reserve, along with the European Central Bank, the Bank of England, the Bank of Canada, and other major central banks, simultaneously cut interest rates by 50 basis points. On October 29, another 50 basis points cut was made, and finally, on December 16, the benchmark interest rate was lowered to 0-0.25%. On November 25, the Federal Reserve announced it would purchase up to $100 billion in government-supported enterprises (GSEs) — Fannie Mae, Freddie Mac, the Federal Home Loan Bank, and direct debts related to real estate, as well as mortgage-backed securities (MBS) guaranteed by the two GSEs and the Federal National Mortgage Association, totaling $500 billion. The first round of QE in the US was thus initiated.

The emergency rescue measures by the US government and the Federal Reserve had some initial effects, but the US stock market did not bottom out until early March 2009. With the implementation of multiple easing policies by the Bush administration and the Federal Reserve, the US stock market stabilized relatively from November to December 2008, with a slight decline of 6.8%. However, entering 2009, due to the continued rise in unemployment rates, a high decline in new non-farm payrolls, worsening retail data, and a drop in the University of Michigan Consumer Confidence Index in February 2009, the persistently weak fundamentals further damaged market confidence. From January to February 2009, the proportion of analysts downgrading S&P 500 earnings expectations surged from 42% at the beginning of the year to over 65%, and the delayed fundamental turning point and weak market sentiment dragged the US stock market down by more than 25% from early January to March 9, 2009.

The easing policy continues to intensify, coupled with signs of recovery in the fundamentals, the US stock market is gradually stabilizing and rebounding. On one hand, on February 17, 2009, Obama passed the American Recovery and Reinvestment Act (ARRA) with a scale of $787 billion; on March 18, the Federal Reserve announced an expansion of the QE program, increasing the purchase of $750 billion in agency MBS and $100 billion in agency debt, raising the total purchase scale to $1.25 trillion and $200 billion respectively, and announced that it would purchase up to $300 billion in long-term Treasury bonds over the next six months. On the other hand, the turning point for economic recovery is gradually emerging. In March 2009, US retail sales year-on-year narrowed compared to the previous month, and the number of new non-farm jobs hit bottom. With the US government's earlier rescue measures and the gradual effectiveness of the Federal Reserve's quantitative easing, coupled with the emergence of a turning point in the fundamentals, market confidence is gradually recovering. Since March 2009, the proportion of analysts revising down the earnings expectations for the S&P 500 has significantly declined, and the S&P 500 index ultimately bottomed out at 676.53 points on March 9, 2009.

2.3. Why are the Chinese and US stock markets diverging: China's economy recovers first

China's stimulus policy is more decisive, and its effect on restoring market confidence is stronger. Comparing the policies implemented by China and the US around November 2008, the "Four Trillion Plan" had a more direct and effective impact on economic improvement. The QE launched by the Federal Reserve on November 25, 2008, mainly involved the purchase of real estate-related bonds, which did not significantly promote the economy. In addition, then Treasury Secretary Paulson stated during his testimony to the House Financial Services Committee that "the purpose of the federal government's TARP program is to stabilize financial markets and credit flows, not to stimulate the economy or help economic recovery." More powerful stimulus policies gave Chinese investors a stronger expectation of economic improvement, and the confidence index of Chinese entrepreneurs hit bottom in Q4 2008. In contrast, it was not until the Obama administration introduced the ARRA Act, which could more directly promote economic recovery, and the Federal Reserve expanded the scope of QE purchases to include Treasury bonds that market confidence began to recover in Q1 2009, and the US stock market gradually stabilized.

The fundamentals of China's economy and corporate profits lead the improvement turning point of the US economy and US stocks. On a macro level, in terms of year-on-year GDP, China's recovery turning point is one quarter ahead of the US, and the recovery strength is relatively stronger; from more frequent PMI data, due to the earlier introduction of large-scale stimulus policies, China's PMI bottomed out and rebounded in December 2008, one month ahead of the US manufacturing PMI, with a steeper recovery slope. On a micro level, the turning point for revenue and net profit growth attributable to the parent company in the A-share market appeared in Q1 2009, while the turning points for revenue and net profit growth attributable to the parent company in the S&P 500 appeared in Q4 and Q3 of 2009, lagging behind the A-share market by 2-3 quarters

3. Third Round: July 2014 - June 2015, A-share Bull Market vs "Mediocre" US Stocks

From July 2014 to June 2015, the Shanghai Composite Index, Shenzhen Component Index, and Wind All A Index rose by 145.9%, 143.9%, and 195.7%, respectively, while the S&P 500, Dow Jones, and Nasdaq rose by 5.4%, 4.0%, and 13.5%, respectively. The excess return of A-shares relative to US stocks reached as high as 140.5%.

3.1 A-share Bull Market under "Stable Growth"

Since the end of 2013, as downward pressure on the economy increased, policies gradually shifted. The economy achieved a "soft landing" at the end of 2012, but thereafter continued to show an "L"-shaped bottoming pattern with little improvement. Throughout 2013, monetary policy maintained strong discipline, and after the "money shortage" in the middle of the year, the growth rate of social financing began to decline rapidly, worsening corporate financing conditions. By the fourth quarter of 2013, downward pressure on the domestic economy increased again, and corporate profits began to decline. On December 13, 2013, the Economic Work Conference set the tone that "there is downward pressure on economic operation," requiring economic work to "adhere to stability while seeking progress and promote reform and innovation."

Since April 2014, domestic monetary policy gradually turned accommodative. On April 22, 2014, the central bank announced a 2 percentage point reduction in the reserve requirement ratio for rural commercial banks in county areas and a 0.5 percentage point reduction for rural cooperative banks in county areas; on April 23, the central bank announced a pilot program for collateralized lending assets at its branches; on June 9, the central bank again announced a 0.5 percentage point reduction in the reserve requirement ratio for commercial banks that meet prudent operation requirements and have a certain proportion of loans to "agriculture, rural areas, and farmers" and small and micro enterprises (excluding institutions that had their reserve requirement ratio reduced on April 25), and a 0.5 percentage point reduction for financial companies, financial leasing companies, and automotive finance companies. Under the policy easing, social financing began to stabilize in April 2014. Subsequently, due to the economic recovery being less than expected, policy easing continued to intensify. In September, the central bank created the Medium-term Lending Facility (MLF) and immediately injected 500 billion yuan of medium-term base currency into the market, and issued the "Notice on Further Improving Housing Financial Services" clearly requiring the relaxation of loan restrictions. In mid-October, the PSL began actual disbursement

Due to factors such as the economy continuing to fall short of expectations, the market experienced multiple fluctuations and adjustments during the third and fourth quarters of 2014. Although the "stabilizing growth" policy began to take effect at the start of 2014, the momentum for leveraging in the real economy remained weak, and macro data continued to fall short of expectations in the second half of 2014. After a surge in July, the market adjusted again in late August and September due to macro data not meeting expectations, and in mid to late October, it significantly corrected due to factors such as the Federal Reserve's announcement to exit QE4 and the delay of the Shanghai-Hong Kong Stock Connect.

Finally, at the end of 2014, monetary policy shifted to comprehensive easing, and the market quickly surged. On November 21, 2014, the central bank announced that it would lower the benchmark deposit and loan rates by 0.25 and 0.4 percentage points, respectively, the next day. The unexpected rate cuts immediately ignited market enthusiasm, with the financial and real estate sectors rising across the board, driving the main index sharply upward. Subsequently, in 2015, the central bank implemented five consecutive rate cuts and five reserve requirement ratio reductions (including two targeted reserve requirement ratio cuts). The benchmark deposit and loan rates were reduced by 125 basis points to 1.50% and 4.35%, respectively, while the reserve requirement ratio fell by 3 percentage points to 17%. Market interest rates declined significantly, with the central bank's 7-day reverse repurchase rate dropping sharply from 3.85% at the beginning of the year to 2.25%. With abundant liquidity, leveraged funds accelerated into the market, and the Shanghai Composite Index rapidly soared to a historic high of 6000 points.

3.2, U.S. Stocks Flattening Under Fed Tightening

Entering 2013, the U.S. economy continued to recover and showed a trend of accelerating growth quarter by quarter. With the help of several rounds of QE, the U.S. fundamentals continued to improve, with real GDP growth rising from 1.57% at the end of 2012 to 2.83% in the third quarter of 2014, and further increasing to 3.76% in the first quarter of 2015.

As the economy gradually overheated, the Federal Reserve also began to gradually implement tightening monetary policy. On May 22, 2013, then-Fed Chairman Ben Bernanke mentioned for the first time that the Fed would reduce the scale of asset purchases starting from some point in the second half of the year. At the FOMC meeting on December 18, the Fed decided to reduce the total monthly purchases of long-term government bonds and MBS from $85 billion to $75 billion starting in January 2014. The Fed officially ended asset purchases in October 2014. In June 2015, the Fed hinted that, given the signs of economic activity decline earlier in the year had receded, it would take interest rate hike actions in the coming months On December 17, 2015, the Federal Reserve officially announced an interest rate hike of 25 basis points.

The contraction of liquidity met resilient corporate earnings, leading to a slight increase in U.S. stocks in 2014. However, as earnings declined, U.S. stocks primarily experienced fluctuations in 2015. Although the Federal Reserve announced a reduction in QE at the end of 2013 and ultimately exited QE in October 2014, U.S. stock earnings rose in 2014, with the S&P 500's revenue and net profit growing by 4% and 8.7% year-on-year, respectively, exceeding the growth rates of 2.3 percentage points and 4.9 percentage points in 2013. Supported by the fundamentals on the numerator side, the marginal tightening of liquidity did not have a significant impact on U.S. stocks, with the S&P 500 rising by 4.1% from July 21, 2014, to the end of the year. However, the continuously "plummeting" oil prices raised concerns about demand, and indeed, U.S. stock earnings significantly declined in Q1 2015, with quarterly net profit growth dropping from 8.71% to 0.85%. In Q2, profit growth turned negative, and the weak fundamentals could no longer support the upward movement of U.S. stocks. In the first half of 2015, the S&P 500 basically maintained a fluctuating and flat trend.

3.3. Why are the Chinese and U.S. stock markets diverging: Relaxed Chinese central bank vs. Tightened Federal Reserve

From the end of 2013 to 2015, the policy cycles of China and the U.S. significantly diverged, with China relaxing and the U.S. tightening. Since the outbreak of the financial crisis, the U.S. has maintained a relatively loose monetary policy, while China began to marginally tighten its policies in 2010. As a result, the U.S. economy has shown growth since 2013, while China's economic growth rate has declined. The different positions in the economic cycle have led to vastly different starting points for policy formulation in China and the U.S. In the U.S., to respond to the gradually overheating economy, the Federal Reserve had just ended QE3 and gradually began signaling interest rate hikes to the market. In China, with significant downward pressure on the economy, central policy shifted to a more relaxed stance, and the central bank repeatedly cut interest rates and reserve requirements.

During the phase of declining corporate earnings growth, the "internally relaxed and externally tight" liquidity environment caused a significant divergence in the valuation expansion of the stock markets in China and the U.S. Analyzing valuation and earnings separately, the divergence in valuation growth is the core reason for the significant divergence between the Chinese and U.S. stock markets in this round. From Q1 2014 to Q1 2015, the absolute values and trends of profit growth in A-shares and the S&P 500 were relatively similar. However, the misaligned monetary policies led to significant divergence in valuations, with the PE_TTM of the Shanghai Composite Index rising nearly 1.5 times from 9.1 to 22.5 from July 2014 to June 2015, while the dynamic price-to-earnings ratio of the S&P 500 only increased by 8.7% during the same period

IV. Summary

The misalignment of the economic and policy cycles between China and the United States may be an important reason for the divergence of the Chinese and U.S. stock markets. In terms of policy, China is in a phase of easing, while the U.S. is either lagging in easing or in a tightening phase. In terms of macroeconomics, the past three independent rallies in the A-share market occurred during China's recovery vs. U.S. recession, China's economic recovery ahead of the U.S., and China's economic growth slowdown vs. the U.S. economy strengthening quarter by quarter.

Further breaking down valuation and earnings, it can be seen that with the misalignment of policy and economic cycles, the valuations and earnings of the Chinese and U.S. stock markets have also diverged. In terms of valuation, the misalignment of policy cycles has led to divergent valuation trends between the Chinese and U.S. stock markets, with the more accommodative liquidity in China benefiting a rapid rise in A-share valuations, while U.S. stock valuations are mainly characterized by fluctuations or declines; in terms of earnings, the "strong China, weak U.S." scenario often occurs during periods of declining earnings in U.S. stocks, during which A-shares have a certain comparative advantage in performance