China Chengxin International: The gold price is expected to fluctuate upward in 2025, and the profitability of gold companies may further improve

China Chengxin International expects gold prices to fluctuate upward in 2025, influenced by factors such as expectations of interest rate cuts by the Federal Reserve, geopolitical tensions, and an expansion of safe-haven demand, which is likely to further improve the profitability of gold enterprises. Although gold consumption demand is under pressure, the operational capabilities of enterprises are improving, capital structures are being optimized, and leverage levels are stable, the industry's credit fundamentals are expected to remain stable. In the next 12 to 18 months, the overall credit quality is not expected to undergo significant changes
According to the Zhitong Finance APP, China Chengxin International has released the "China Gold Industry Outlook (January 2025)", which points out that since 2024, factors such as the continued expectation of interest rate cuts by the Federal Reserve, escalating geopolitical tensions, and increased demand for safe-haven assets have driven gold prices to new highs, with an annual increase of over 20%. The overall gold supply remains relatively stable, but the rise in prices has put pressure on gold consumption demand. With the rapid increase in gold prices, the operational capabilities and cash generation abilities of gold companies have further improved, reducing their reliance on external financing, resulting in a more favorable capital structure and relatively stable leverage levels. Due to the ongoing uncertainties in geopolitical situations, Federal Reserve monetary policy, and fiscal politics, the increased demand for gold as a safe-haven asset is expected to support future gold price performance. Gold prices are projected to trend upward in 2025, and the increased profits of upstream mines in this context may further enhance the profitability of gold companies, maintaining stability in the industry's credit fundamentals.
China Gold Industry Outlook
Since 2024, the continued expectation of interest rate cuts by the Federal Reserve, heightened geopolitical tensions, and increased demand for safe-haven assets have driven gold prices to new highs, with an annual increase of over 20%. With both volume and price rising in the gold sector, corporate profitability has improved. Although corporate debt levels have increased, the overall credit level remains stable due to the unique nature of gold, optimized debt structures, and a loose monetary environment. China Chengxin International believes that the overall credit quality of the industry will not undergo significant changes in the next 12 to 18 months. 
Key Points
Since 2024, the continued expectation of interest rate cuts by the Federal Reserve, escalating geopolitical tensions, and increased demand for safe-haven assets have driven gold prices to new highs, with an annual increase of over 20%. The uncertainties in geopolitical situations, Federal Reserve monetary policy, and fiscal policy still exist, and the increased investment demand for gold as a safe-haven asset has a positive impact on gold price performance.
Global gold supply remains relatively stable, with a slight increase in mined gold production since 2023. The overall rise in gold prices has significantly stimulated the supply of recycled gold, leading to a year-on-year increase in gold supply, although the overall fluctuations on the supply side are small and have little impact on gold prices.
Since 2024, the soaring gold prices have continued to suppress demand for gold jewelry and gold ETFs investment, leading to fluctuations in gold investment and central bank gold purchases, resulting in a slight decline in gold demand. However, benefiting from off-exchange trading supplements, total gold demand in the first three quarters still showed year-on-year growth. If the gold demand side improves further in the future, gold may achieve a relatively balanced supply and demand situation.
Since 2023, the simultaneous increase in volume and price in the gold sector has led to continuous improvement in the profits and cash flow of gold companies. The advancement of expansion projects and resource mergers and acquisitions has increased funding demand, resulting in an overall expansion of total debt. However, the optimization of debt structures and a loose monetary environment have kept short-term liquidity pressure low, and benefiting from the unique nature of gold, the overall credit level remains stable
I. Analytical Approach
The credit fundamental analysis of the gold industry mainly involves analyzing the trends in gold prices and the relevant factors affecting gold supply and demand, making judgments on price trends, and subsequently analyzing the impact of price trends on the financial condition of the industry, corporate profitability, and leverage levels, among other changes in credit fundamentals. This article points out that gold supply and demand have a certain impact on prices, but against the backdrop of increasing economic uncertainty, the demand for gold as a safe haven and a store of value, as well as real interest rates, have a more significant impact on prices. Benefiting from the increase in gold prices and production and sales volumes, the profitability and operational cash generation ability of gold companies have improved. Although the leverage ratios of gold companies have shown some differentiation, the overall credit level remains stable due to the uniqueness of gold and the optimization of debt structures.
II. Industry Fundamentals
Gold Prices and Financial Attributes
Since 2024, expectations of interest rate cuts by the Federal Reserve, escalating geopolitical tensions, and expanding safe-haven demand have driven gold prices to new highs, with prices rising over 20% within the year. The uncertainties surrounding geopolitical issues, as well as the Federal Reserve's monetary and fiscal policies, continue to exist, and the increased investment demand for gold as a safe-haven asset has boosted gold price performance.
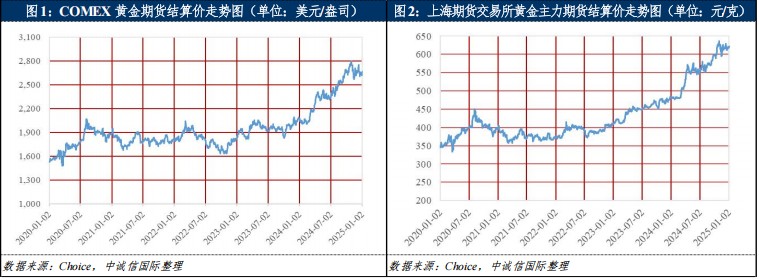
Affected by the sustained expectations of interest rate cuts by the Federal Reserve and the intensifying geopolitical situation, the demand for gold as a hedge against currency depreciation and political and economic risks has remained strong. Since 2024, gold prices have repeatedly reached new highs, with the year-end COMEX gold futures settlement price closing at $2,641.00 per ounce, and the average price for the year being $2,403.55 per ounce, a year-on-year increase of 22.97%. Specifically, at the beginning of 2024, U.S. non-farm employment data exceeded expectations, and the Federal Reserve's interest rate cuts faced challenges, but U.S. retail sales were weak, and the GDP for the fourth quarter of 2023 was below expectations. Coupled with tensions in the Red Sea shipping lanes, the Israel-Palestine situation, and downgrades of New York community banks, market risk aversion was triggered. At the same time, the central bank's trend of purchasing gold continued to support gold prices, with COMEX gold prices climbing from around $2,000 per ounce to over $2,400 per ounce. In late April, better-than-expected U.S. economic data and a stronger dollar caused gold prices to give back some gains; in May, the Federal Reserve's interest rate decision signaled a dovish stance, and the uncertainty in the U.S. macro environment, combined with escalating geopolitical factors, led to continued fluctuations and upward movement in gold prices.
In September, the Federal Reserve began a rate-cutting cycle with a 50 basis point cut, slightly exceeding market expectations. The Federal Reserve's accommodative monetary policy is expected to continue, and geopolitical influences have not dissipated, leading to a strong rise in gold prices. On October 30, the COMEX gold futures settlement price reached $2,800.80 per ounce, the highest point of the year. In November, the Federal Reserve cut rates again by 25 basis points, but the expectation of a slowdown in rate cuts due to Trump's election victory and a partial easing of geopolitical tensions negatively impacted gold prices, leading to a significant correction. Subsequently, the escalation of the Russia-Ukraine situation triggered global asset risk aversion, causing gold prices to rise again. In December, the Federal Reserve continued to cut rates by 25 basis points, but the Fed's hawkish statements led to a decline in rate cut expectations for 2025, resulting in high-level fluctuations in gold prices.
Domestically, since 2024, domestic gold prices have closely followed international gold price trends. The Shanghai Futures Exchange (SHFE) gold futures settlement price remained stable in January and February, surged significantly in March, and then peaked at 590.65 yuan per gram in April before starting to decline, later fluctuating around 560 yuan per gram Since September, the People's Bank of China has lowered interest rates and reserve requirements, reduced existing mortgage rates, and promoted the entry of medium- and long-term funds into the market, which has increased market liquidity and boosted market confidence while also increasing investment demand. This has driven domestic gold prices up, with the year-end SHFE gold settlement price reaching 616.68 yuan/gram, a significant increase of 28.30% compared to the beginning of the year, and the average annual price was 559.11 yuan/gram, a year-on-year increase of 24.11%.
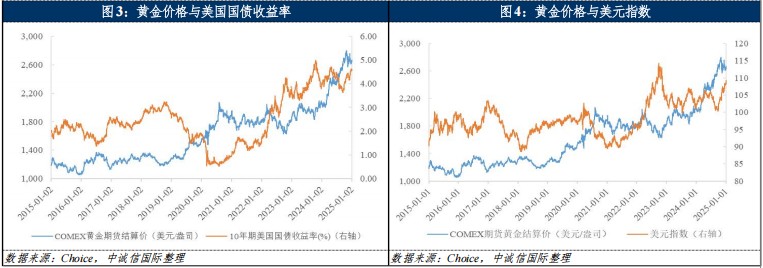
The price attributes of gold include both commodity and financial attributes, where demand factors have a certain impact on the commodity attributes, but the financial attributes have a greater influence. Under its financial attributes, gold can essentially be viewed as a long-term inflation-protected bond, with strong demand for hedging against currency depreciation and political-economic risks. Therefore, the core factor driving gold prices under financial attributes is the real interest rate. For instance, using the yield on 10-year U.S. Treasury bonds to represent the risk-free rate, when the risk-free rate declines, the opportunity cost of holding gold decreases, leading to significant purchases of gold and an increase in gold prices. The rise in gold prices in previous years often coincided with economic and political risk events and a decline in Treasury yields. The three interest rate cuts by the Federal Reserve in 2024 have led to a surge in gold prices since September, and expectations of further rate cuts in 2025 may still bring about a decline in real interest rates. In terms of its relationship with the U.S. dollar, gold prices also exhibit a certain negative correlation with the dollar. This negative correlation arises partly because the dollar is the fundamental pricing tool for gold, and a weaker dollar corresponds to a relative increase in the price of the priced object. On the other hand, gold serves as a general currency equivalent; when the dollar is weak and sold off, the corresponding value of other currencies tends to rise. Inflation can also influence gold prices to a certain extent. In 2024, the U.S. economy faces some inflationary pressures, but it remains above target levels. In a high-inflation environment, gold's appeal as an inflation-hedging asset increases, prompting investors to increase their allocation to gold, thereby driving up gold prices.
In traditional gold pricing, gold prices typically move inversely with U.S. Treasury yields and the dollar, but factors such as geopolitical risks and the dollar credit crisis can disrupt gold prices. The Middle East crisis in October 2023, for example, led to an increase in market risk aversion, during which both U.S. Treasury yields and gold prices rose simultaneously. Since September 2024, resilient U.S. consumption data has improved market expectations for the economic outlook, driving up Treasury yields. However, ongoing geopolitical tensions and concerns about rising inflation have also pushed gold prices up in September and October. Overall, from 2023 to 2024, the yields on 10-year Treasury bonds and the U.S. dollar index have shown wide fluctuations. Against the backdrop of a strong dollar, geopolitical risks, risk aversion, and central bank gold purchasing demand have continued to drive gold prices higher.
Looking ahead to 2025, inflationary pressures in the U.S. economy have not been completely eliminated, and expectations for interest rate cuts remain, which will still provide some support for gold prices. However, based on the core policy propositions of Trump's second term, such as "lowering interest rates, domestic tax cuts, restricting immigration, and increasing tariffs," the Federal Reserve's monetary policy will still face a degree of uncertainty If inflation rebounds in the United States, prompting the Federal Reserve to tighten monetary policy more than expected, a strong dollar may bring short-term downward pressure on gold prices. However, increased tariffs could lead to a slowdown in U.S. economic growth, and the rising fiscal deficit makes it difficult to change the high burden of U.S. government debt in the short term. The dollar is expected to remain flat or slightly weaken, further enhancing gold's attractiveness and positively impacting the long-term price of gold. Additionally, there are no significant signs of easing in geopolitical tensions in the Middle East, the Korean Peninsula, and the Russia-Ukraine conflict, which may also drive up gold prices. Overall, uncertainties regarding geopolitics, Federal Reserve monetary policy, and fiscal policy in 2025 may increase investment demand for gold as a safe-haven asset, boosting its long-term price performance.
Gold Supply
Global gold supply remains relatively stable, with a slight increase in mined gold production since 2023. The overall rise in gold prices has significantly stimulated the volume of recycled gold, leading to a year-on-year increase in gold supply. However, the overall fluctuations on the supply side of gold are minor, having little impact on gold prices.
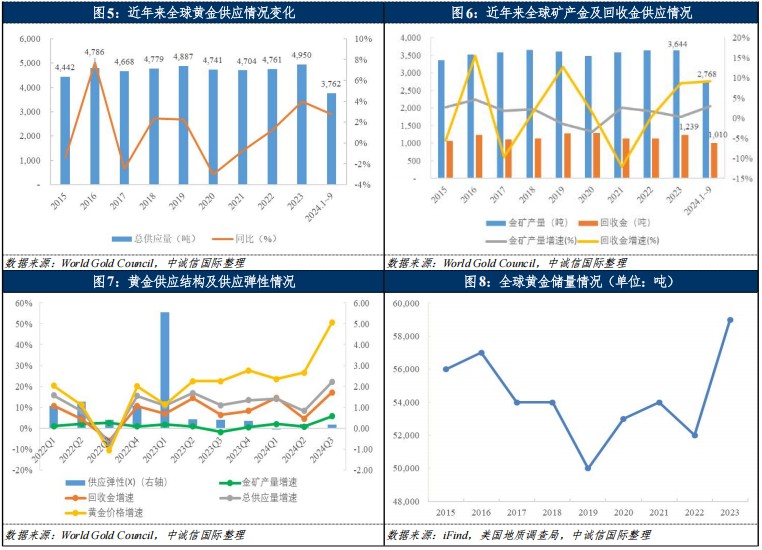
The global gold supply mainly comes from gold mining and recycled gold processing, along with a small amount of net hedging by producers. In recent years, the supply structure has been relatively stable. The total global gold supply for 2023 and the first three quarters of 2024 is expected to be 4,950.0 tons and 3,761.9 tons, respectively, representing year-on-year growth of 3.97% and 2.74%.
In terms of mined gold, gold is a non-renewable resource. According to the U.S. Geological Survey (USGS), as of the end of 2023, global gold reserves are approximately 59,000 tons. Due to resource reserves and mining technology, the overall potential for increased production remains insufficient. In 2023, gold mining produced 3,643.9 tons, a year-on-year increase of 0.30%, accounting for 73.61% of the total global gold supply, with stable mining output year-on-year. In the first three quarters of 2024, benefiting from favorable market opportunities, gold mining production is expected to grow by 2.96% year-on-year to 2,768.4 tons, accounting for 73.59% of the total global gold supply. The volume of recycled gold is mainly influenced by gold price trends. Since 2023, gold prices have continued to rise, breaking historical highs, which has improved the economics of gold recycling. The volume of recycled gold for 2023 and January to September 2024 is expected to be 1,238.7 tons and 1,009.6 tons, respectively, with year-on-year growth rates of 8.65% and 9.11%. In terms of supply elasticity, since 2023, gold prices have risen significantly, with slow growth in mined gold and an increase in recycled gold supply. However, the overall increase in gold supply is limited, indicating relatively low supply elasticity.
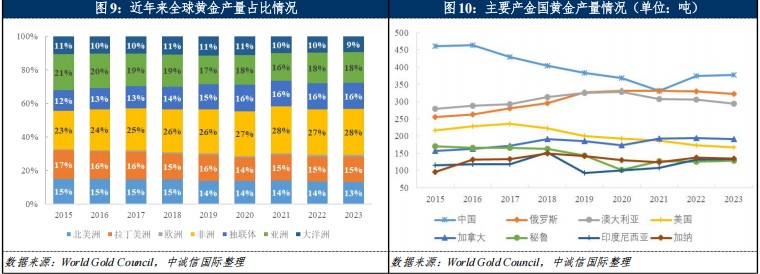
 From a regional distribution perspective, the trends in gold production vary across different areas. Africa is rich in gold mineral resources and has a wide distribution. In recent years, its production has consistently ranked first in global gold output, and with the acceleration of the development of multiple mines, production in Africa has grown rapidly, with mineral gold production in Africa surpassing 1,000 tons for the first time in 2023. China is the largest gold producer in the world, and in 2023, the production of major mines has returned to the pre-reform levels of non-coal mines in Shandong Province, with mineral gold production slightly increasing to 378.2 tons. The increase in Turkey's mineral gold production has also contributed to the recovery of mineral gold production in Asia.
Domestically, by the end of 2023, China's gold mine reserves stood at 3,203.77 tons, accounting for about 5% of the global total reserves. The distribution of gold mines in China is uneven, mainly concentrated in Shandong, Henan, Jiangxi, Inner Mongolia, Yunnan, and Gansu provinces. In terms of exploration and reserve increase, Shandong Province has made significant breakthroughs in the new round of exploration and breakthrough strategic actions, with the Xiling Gold Mine in Laizhou, Shandong, becoming the largest single gold deposit discovered in the country, classified as a world-class giant single gold deposit. Preliminary estimates indicate that the Xiling Gold Mine has added nearly 200 tons of gold metal, with a cumulative gold metal amount reaching 580 tons. In November 2024, the Hunan Geological Institute announced the discovery of over 40 gold veins more than 2,000 meters underground in the Wangu Gold Mine Field in Pingjiang County, with the cumulative gold resource amount in the core exploration area reaching 300.2 tons, and the gold grade reaching up to 138 grams per ton. It is also predicted that the prospective gold reserves more than 3,000 meters underground will exceed 1,000 tons, making the Wangu Gold Mine Field one of the largest gold mines in the world, bringing new momentum for domestic gold mine production increases.
As the easily extractable resources from old domestic mines gradually decrease, new large mines such as the Haiyu Gold Mine, Shaling Gold Mine, and Xiling Gold Mine have not yet formed new production capacities. In recent years, domestic enterprises have increasingly broken through domestic resource constraints and intensified their efforts in mergers and acquisitions and development of foreign resources. Specifically, Zijin Mining Group Co., Ltd. completed the acquisition of the Rosebel Gold Mine project in Suriname in 2023; in October 2024, Zijin Mining plans to invest $1 billion to acquire the Akyem Gold Mine in Ghana, and later completed the acquisition of the La Arena Gold Mine in Peru in December, further enriching its resource reserves. A subsidiary of Shandong Gold Mining Co., Ltd., Shanjin International Gold Co., Ltd., completed the acquisition of shares in Osino Resources Corp. in August 2024, adding approximately 127.2 tons of gold resources. Since 2023, Zhaojin Mining Co., Ltd. has completed the acquisition of 100% equity in Tietuo Mining and the controlling stake in the Kemahong Gold Mine, with the gold resource amount of the Abuja Gold Mine under Tietuo Mining totaling approximately 119 tons. With the continuous advancement of the "going out" strategy, key Chinese gold enterprises have achieved a continuous increase in mineral gold production from overseas mines, with gold production reaching 60.38 tons in 2023 and 51.90 tons in the first three quarters of 2024, representing year-on-year increases of 18.28% and 20.50%, respectively It is worth noting that domestic companies are increasing their efforts to integrate foreign resources, but some of the acquired projects require a certain construction period and production ramp-up period, which may have a delayed impact on performance. Additionally, companies with significant overseas mineral assets face risks related to local political and economic changes affecting their control over mining rights, as well as certain community risks. Exchange rate and policy risks also pose significant challenges to the development of overseas businesses.
Overall, global gold supply remains relatively stable. Since 2023, global mined gold production has slightly increased, and the significant rise in gold prices has stimulated a notable increase in recycled gold supply, leading to an overall increase in gold supply. However, the elasticity of gold supply is relatively low, and gold prices continue to remain above production costs, meaning that changes on the supply side have little impact on gold prices.
Gold Demand
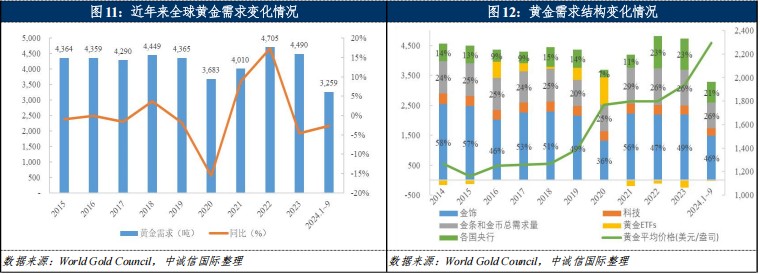
Since 2024, soaring gold prices have continued to suppress demand for gold jewelry and gold ETFs investment. Demand for gold investment and central bank purchases has fluctuated, leading to a slight decline in gold demand. However, benefiting from off-exchange trading, total gold demand in the first three quarters still showed year-on-year growth. If gold demand improves further in the future, gold may achieve a relatively balanced supply and demand situation.
Gold demand mainly comes from gold jewelry consumption, technological manufacturing, investment in gold bars and coins, and the demand generated by gold ETFs and central bank reserves. The total gold demand for the entire year of 2023 (excluding off-exchange trading, with the data in the chart not including off-exchange trading volume) was 4,490 tons, a year-on-year decrease of 4.57%. However, if off-exchange trading (460 tons) is included, total gold demand achieved growth. In the first three quarters of 2024, gold demand (excluding off-exchange trading) was 3,259 tons, a year-on-year decrease of 2.69%.
Specifically, in 2023, global gold jewelry consumption demand remained basically stable. By country, the rise in gold prices led to a decline in gold jewelry consumption demand in most countries, but the recovery of the Chinese economy and the increase in marriage rates boosted gold jewelry consumption demand in China, which with a demand of 671.9 tons surpassed India to regain the title of the largest gold jewelry consumer. In the first three quarters of 2024, soaring gold prices suppressed gold jewelry consumption demand, leading to a year-on-year decline of over 10% in global gold jewelry demand to 1,328.34 tons, with the proportion of gold jewelry consumption in total gold demand decreasing.
The use of gold in technology accounts for a small proportion of global gold demand structure, mainly covering electronic gold, other industry gold, and dental gold, with electronic gold accounting for about 80% of technological gold. Rising gold prices have negatively impacted the demand for electronic gold, leading to weak demand for electronic gold in 2023, with technological gold demand decreasing by 3.06% to 305.2 tons. However, since the fourth quarter of 2023, the AI boom has led to a recovery in the semiconductor industry, providing some support for technological gold demand. From January to September 2024, as demand warmed up, technological gold demand increased by 9.31% year-on-year to 243.7 tons.
Physical gold and gold ETFs together constitute gold investment demand, with physical gold investment mainly covering gold bars and coins. In 2023, the investment volume in gold bars and coins was 1,189.6 tons, a year-on-year decrease of 2.66% From a regional perspective, the demand for physical gold investment shows a trend of "rising in the East and declining in the West." Influenced by rising interest rates and the cost of living crisis, gold investment in European countries, represented by Germany, has significantly decreased. In contrast, the poor performance of the Chinese stock market and real estate market has highlighted gold's role as a risk hedge. Turkey has also significantly increased its gold investment under the dual pressure of high inflation and currency depreciation. The increase in investment in these two regions has largely offset the decline in investment from European countries. In the first three quarters of 2024, the trend of divergence in global physical gold investment demand continued, with the investment volume in gold bars and coins at 859.34 tons, a slight year-on-year decrease of 1.74%.
Gold ETFs play a relatively important role in asset allocation due to their characteristics as most tradable financial instruments and their certain negative correlation with the returns of general securities investment tools. Compared to the physical gold bar market, the Asian market, primarily led by China, accounts for a relatively low proportion (about 5%) of the global gold ETF holdings, which are dominated by the European and American markets. In 2023, impacted by soaring interest rates and a strong dollar, global gold ETF investment demand was -244.2 tons, with European funds experiencing the highest net outflow. The annual gold ETF investment demand was -180 tons, leading to negative global investment demand. The changes in gold ETF holdings in Asia (mainly China) also show a strong positive correlation with physical gold investment demand, with Asia's ETF investment demand in 2023 at 19 tons, of which China accounted for 10 tons. At the beginning of 2024, gold ETF demand continued to be negative. However, as multiple countries began a rate-cutting cycle and geopolitical tensions in the Middle East intensified, support for gold ETF inflows was provided, with global gold ETF investment demand from January to September at -25.5 tons.
In terms of central bank reserves, gold holds an important position in the asset allocation of central banks worldwide. In 2023, central banks in developing countries, represented by China, maintained a steady pace of gold accumulation, while some developed countries also chose to increase their gold holdings. The central banks of China, Poland, and Singapore, as the top three gold purchasers, jointly drove the ongoing gold purchasing trend among global central banks, with total net gold purchases reaching 1,037 tons for the year. From January to September 2024, influenced by high gold prices, the pace of gold reserve increases by various central banks has slowed, with net gold purchases at 693.5 tons, a year-on-year decrease of 16.79%. The People's Bank of China also suspended gold accumulation for six consecutive months from May to October 2024, ending its previous record of 18 consecutive months of gold accumulation. In November, as gold prices corrected from high levels, the central bank resumed its gold purchases.
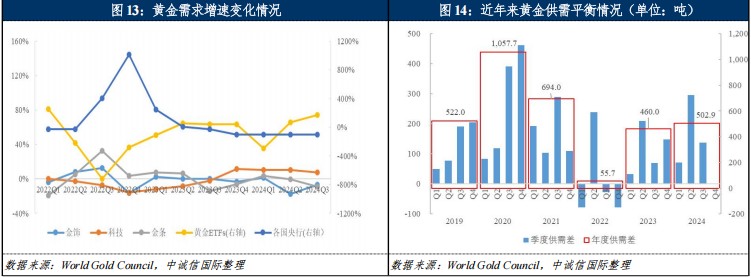
Overall, since 2024, central bank reserves have maintained a certain demand resilience. However, the rise in gold prices has led to a decrease in gold jewelry consumption demand and a decline in gold ETF investments. The demand for gold in the first three quarters has slightly decreased year-on-year. The increase in over-the-counter trading activities has promoted global gold demand, and its contribution to total global gold demand cannot be ignored. However, the lack of publicly available and transparent data increases the uncertainty of the gold demand outlook. If the demand side for gold improves further in the future, gold may welcome a relatively balanced supply and demand situation Despite the supply-demand imbalance, gold pricing is determined by the circulating portion of the market, which is relatively small in scale, and is not a complete commodity pricing mechanism. Instead, it possesses attributes of a financial instrument, so the relative supply-demand imbalance has not overly affected gold pricing.
III. Industry Financial Performance
Since 2023, the gold sector has seen both volume and price increases, leading to sustained improvements in profits and cash flow for gold companies. The advancement of expansion projects and resource mergers and acquisitions has driven capital demand, resulting in an increase in total debt scale. However, the optimization of debt structure and a loose capital environment have minimized short-term liquidity pressure, and benefiting from the uniqueness of gold, the overall credit level remains stable.
Overview of Sample Companies
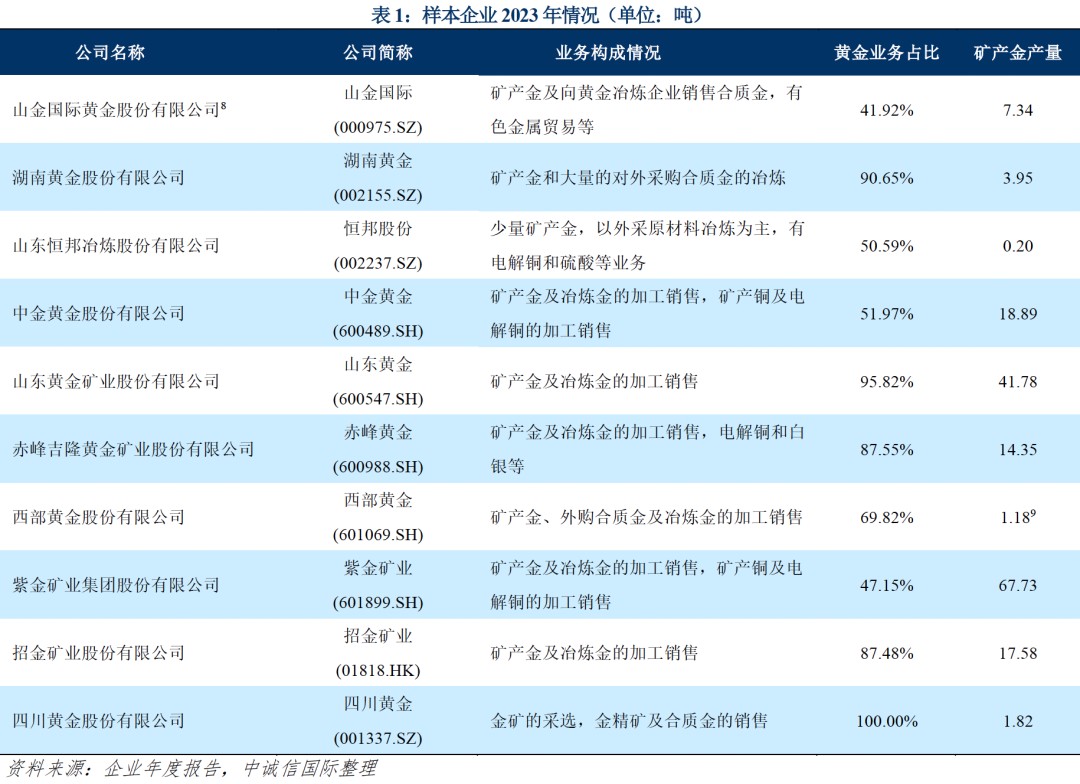
China Chengxin International selected all listed gold companies in the A-share market through the Shenwan industry classification, excluding ST companies, while adding Zhaojin Mining Industry Co., Ltd., a company issuing bonds in the interbank market, as a sample company. A total of 10 sample companies were included. In 2023, based on stable production operations, gold companies accelerated resource reserves and production through mergers and acquisitions, achieving operating revenue of 494.509 billion yuan in the gold industry (mining sector). During the same period, the total revenue of the gold business segment of the sample companies was 302.475 billion yuan, covering major domestic gold production enterprises and demonstrating high representativeness.
Except for Yintai Gold and Sichuan Gold, which do not have gold smelting businesses and mainly sell refined gold and gold concentrates to gold smelting companies, the other sample companies cover the entire gold industry chain. Due to differences in the completeness of the gold industry chain among companies and the revenue weight of mined gold and smelted gold segments, as well as the fact that some companies also have significant revenues from electrolytic copper, silver, and other businesses, financial performance varies slightly under different market price fluctuations of various metals and the differing positions of companies in the upstream, midstream, and downstream of the industry chain.
Profitability
Since 2023, benefiting from the continuous rise in gold prices and increases in production and sales volumes, the revenue and profit levels of the gold business segment of the sample companies have improved. The profitability of non-gold business segments is generally weaker than that of gold businesses, but still contributes to overall profitability.
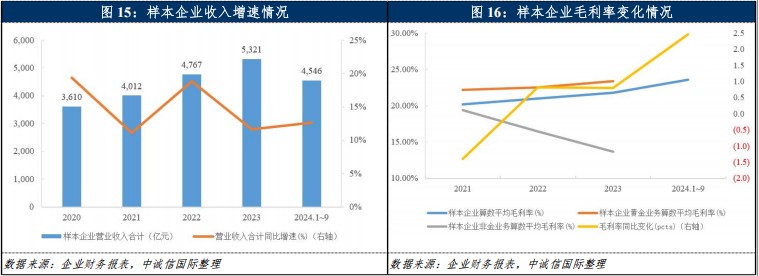
In terms of total operating revenue, since 2023, benefiting from the rise in gold prices and increases in production and sales volumes, the total operating revenue of the sample companies has grown, with revenues of 532.099 billion yuan in 2023 and 454.550 billion yuan from January to September 2024, representing year-on-year growth of 11.62% and 12.62%, respectively. Due to the high base from the same period last year, the revenue growth rate of the sample companies has slowed. Among them, Zijin Mining, which accounts for over 55% of the total revenue of the sample, achieved record high production of mined copper and gold in 2023, increasing total operating revenue by 23.074 billion yuan, significantly contributing to the total operating revenue of the sample companies. Additionally, benefiting from the release of gold smelting capacity, Humon Share experienced significant revenue growth, also contributing greatly to the expansion of overall operating revenue In terms of gross profit margin[10], the rise in gold prices has led to an overall improvement in the profitability of gold companies. The arithmetic average operating gross profit margin of the sample companies in 2023 is 21.83%, which has increased year-on-year, but the performance of gross profit margins varies due to different positions in the industry chain. Specifically, gold companies with a primary focus on upstream mining have seen an increase in gross profit margins, while those primarily engaged in gold smelting have experienced a decline. The central gross profit margin of the gold segment for the sample companies has slightly increased, but the gross profit margin for non-gold businesses of the sample companies has decreased by 2.83 percentage points year-on-year, indicating that the performance of non-gold businesses is generally weaker than that of gold businesses.
In the first three quarters of 2024, benefiting from the continued rise in gold prices and the effective control of unit sales costs by some sample companies, the arithmetic average operating gross profit margin level of the sample companies has improved year-on-year.
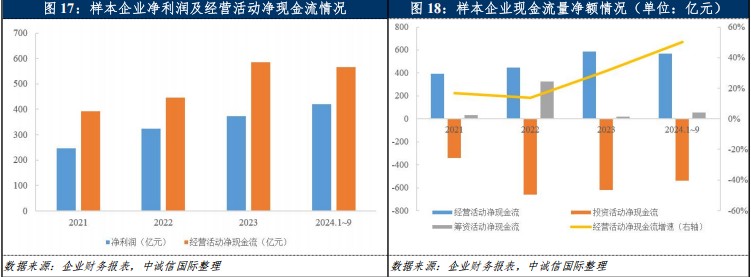
In terms of net profit, the total net profit of the sample companies in 2023 is 37.239 billion yuan, a year-on-year increase of 15.23%; since 2024, the sample companies have maintained strong profitability, with a total net profit of 42.092 billion yuan in the first three quarters, a year-on-year increase of 53.26%. Overall, the rise in gold prices has shown a positive impact on the profitability of companies, with the sample companies achieving a high growth rate in net profit, further enhancing profit levels, and companies with resources exhibiting higher profitability stability.
Cash Generation Ability and Debt Repayment Ability
With the rise in gold prices, the sample companies have maintained a strong operational cash generation ability since 2023, coupled with a decline in investment demand, resulting in a narrowing of financing needs.
In terms of cash generation ability, the sample companies have maintained a strong operational cash generation ability, with net cash flows from operating activities for the sample companies being 58.590 billion yuan and 56.625 billion yuan for 2023 and January to September 2024, respectively, representing year-on-year increases of 31.25% and 50.37%. The factors affecting operational cash generation ability mainly include profitability levels and capital occupation situations. The costs at the mining end of gold companies are relatively fixed, and changes in operating costs are mainly determined by the prices of externally sourced raw materials and scale. Gold companies in the upstream of the industry have significantly improved their profitability against the backdrop of rising gold prices; regarding capital occupation, apart from Sichuan Gold and Shandong Gold International selling gold concentrates and refined gold to downstream companies in the gold industry chain, other gold companies sell their end products to gold exchanges. The actual accounts receivable and corresponding bad debt losses generated by the gold business segment are not substantial, and accounts receivable generally occupy a small portion of the companies' cash flow. Since 2023, with the rise in gold prices, the inventory occupation of funds by the sample companies has increased, but due to their strong realizable capability, the risk is controllable.
In addition, the overall investment process of the sample companies has slowed down, with net cash outflows from investment activities in 2023 narrowing year-on-year. At the same time, most sample companies have sufficient free cash flow, and the gold market's heat and asset premium levels are relatively high, leading to a reduction in net financing scale. In the first three quarters of 2024, Zhaojin Mining and Shandong Gold International completed overseas gold mine acquisitions in succession, resulting in an expansion of the net cash outflow exposure from investment activities for the sample companies year-on-year
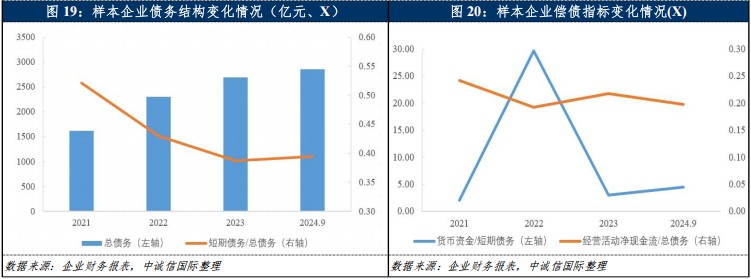
Since the beginning of 2023, against the backdrop of rising gold prices, several companies have undergone varying degrees of scale expansion. Although the changes in the asset-liability ratios of gold companies have shown some divergence, the overall capital structure remains relatively favorable, and the leverage level is relatively stable. The short-term liquidity pressure on the sample companies is not significant, and the overall credit level remains stable.
From 2023 to the end of September 2024, the average asset-liability ratios of the sample companies were 42.36% and 42.99%, respectively, achieving continuous repair from the income statement to the balance sheet, with an overall favorable capital structure. Benefiting from improved profitability, the accumulation of undistributed profits has led to a declining trend in the asset-liability ratios of many sample companies. However, the expansion of operational scale, the advancement of expansion projects, and resource mergers and acquisitions have somewhat increased their funding needs, resulting in a slight rise in the asset-liability ratios of a few companies.
As of the end of 2023, the total debt of the sample companies amounted to 269.367 billion yuan, a year-on-year increase of 17.03%, with short-term debt accounting for 38.74%, a decrease of 4.22 percentage points year-on-year. By the end of September 2024, the total debt of the sample companies slightly increased to 285.741 billion yuan, with short-term debt accounting for 39.46%, a slight increase of 0.72 percentage points compared to the end of the previous year. In the context of rising gold prices, many companies have undergone varying degrees of scale expansion, and the increase in the purchase of raw materials has also expanded the companies' demand for operating funds. Since 2023, the total debt of the sample companies has increased; however, due to the impact of the previous high base, the growth rate of debt scale has slowed down. In addition, in the context of declining interest rates, companies have adjusted their debt structures, leading to an increase in the proportion of long-term debt, optimizing the debt structure of gold companies.
In terms of debt repayment indicators, after excluding sample companies with significant disturbances, the average coverage multiple of cash against short-term debt has continued to rise, mainly due to the decrease in short-term debt scale and the liquidity brought by rising gold prices, resulting in low short-term liquidity pressure for gold companies. In 2023 and from January to September 2024, the average coverage multiple of net cash flow from operating activities against total debt was 0.22 times and 0.20 times, respectively, both showing year-on-year improvements. Several gold companies, including Zijin Mining and SD-GOLD, have seen continuous improvement in cash flow, with the growth rate of total debt scale being lower than that of net cash flow from operating activities, leading to an optimization of related debt repayment indicators. Overall, the uniqueness of gold allows gold companies to have a strong ability to liquidate operational assets, and they can enhance liquidity through low-cost gold leasing, maintaining overall credit levels stable.